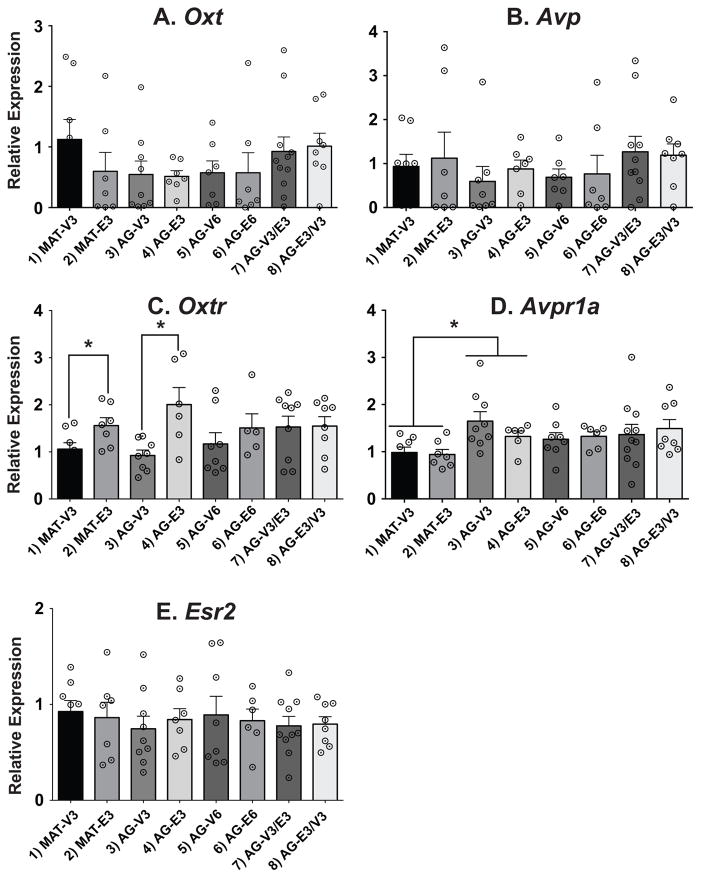
Figure 2.
Relative gene expression data are shown in the PVN. Note that the scale of the y-axis varies depending on the gene. Comparisons of age were made in groups 1–4, duration of hormone in groups 3–6, and timing of hormone in groups 5–8. Oxt, Avp and Esr2 were unaffected by treatment, age, duration, or timing. For Oxtr there were significant hormone effects in the 3-mo treated groups, with expression higher in the E2 groups. For Avpr1a, there was a significant age effect in those same groups, with levels increasing from the mature to the aging animals. White circles with black center dots indicate individual rat data, and data shown are mean ± SEM. *, p < 0.05.

