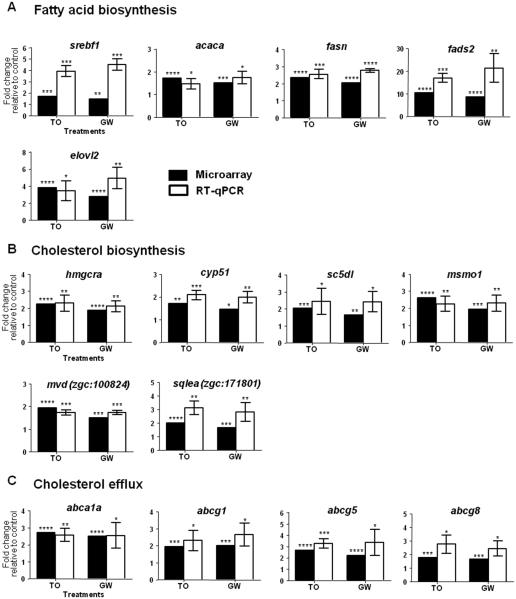
Figure 2. RT-qPCR validation of selected genes and comparison with microarray data.
qPCR analysis was performed on selected genes involved in fatty acid biosynthesis (A), cholesterol biosynthesis (B) and cholesterol efflux (C). qPCR results are presented as mean ± s.d. (n=3 pools of 30 larvae each), expression levels were normalized to β-actin (bac2) and statistical significance was determined using unpaired two-tailed Student’s t-test compared to the control treatment (*P<0.5,**P<0.01,***P<0.001,****P<0.0001). Black bars represent microarray results and white bars RT-qPCR results. T0901317 and GW3965 treatments are abbreviated as T0 and GW, respectively.

