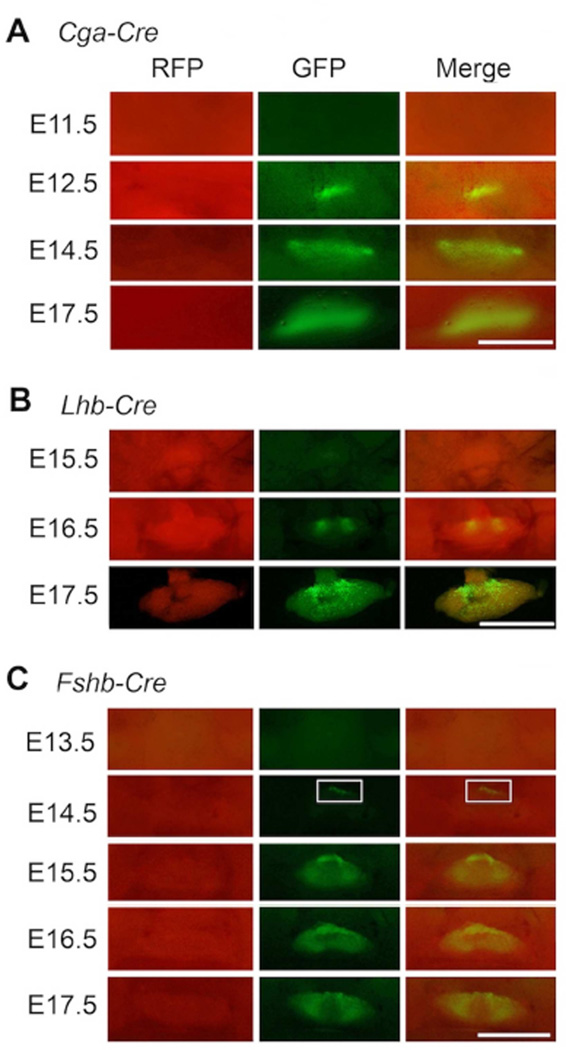
Fig. 3.
Comparison of CRE recombinase activity assayed in vivo by fluorescence visualization of tdTomato (indicated as RFP) to GFP conversion during embryonic pituitary development in three different gonadotrope-specific Cre-deleter mouse strains on an mT/mG genetic background (A–C). A representative example of pituitary harvested at each embryonic time point from each strain is shown. White box (in C) shows a group of GFP+ gonadotropes in pituitary of an Fshb-Cre+ mouse embryo at E14.5. White bar = 2mm.

