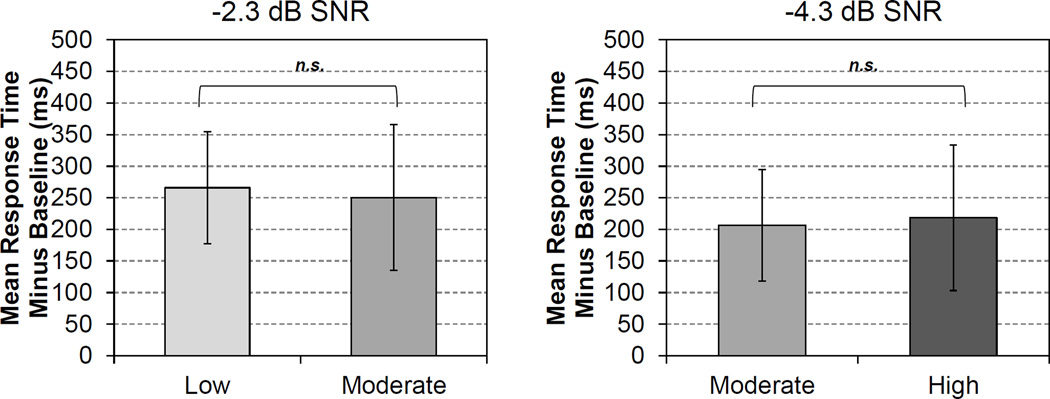
Figure 3.
Mean response times (ms) for the constant signal-to-noise ratio (SNR) conditions when reverberation was changed from low to moderate (left panel; research question C) and from moderate to high (right panel; research question D). Error bars indicated ±1 standard deviation from the mean. Non-significant effects are marked with “n.s”

