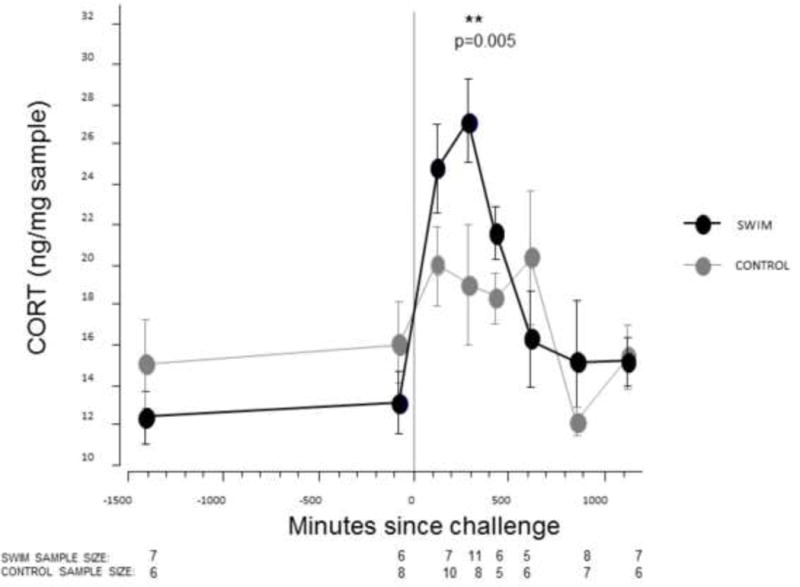
Figure 4.

Effects of swim challenge on fecal CORT metabolites. Mean fecal CORT before and after the swim challenge, with each data point representing the midpoint of each sample collection time interval. Data presented as Mean ± SE. “Time zero” indicates the beginning of the swim challenge. Sample sizes are reported below each time window.
