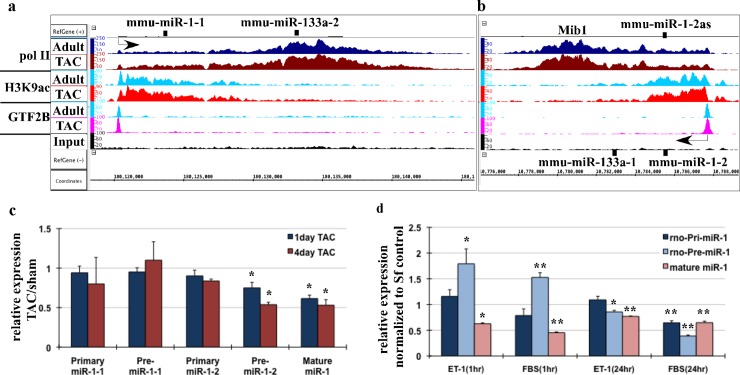
Fig 1. MiR-1 expression is posttranscriptionally regulated during cardiac hypertrophy.
Pool of three sham/adult and TAC operated mouse hearts were used for anti-RNA pol II, anti-H3K9ac and anti-Gtf2b ChIP-Seq. Binary analysis files (BAR) from the ChIP-Seq data was viewed in Affymetrix’s Integrated Genome Browser (IGB), which shows the fragment densities of RNA pol II, H3K9ac and Gtf2b (y-axis) aligned in 32–50 nucleotide bins along the chromosomal coordinates (x-axis) for miR-1-133 clusters. The arrow indicates the transcription start site and the direction of transcription. (a) IGB images of miR-1-1 and miR-133a-2 transcript with RNA polII, H3K3ac and Gtf2b densities across intergenic regions of chromosome 2. (b) IGB images of miR-1-2 and miR-133a-1 cluster with RNA polII, H3K3ac and Gtf2b densities within the Mindbomb 1 (Mib1) gene located in chromosome 18. (c) Total mRNA extracted from mouse hearts from sham or TAC operated hearts for 1day or four days were used for qPCR analysis of primary, pre-miR-1-1, pre-miR-1-2 and mature miR-1 levels. The results were normalized to 18S (primary and pre- transcript) or U6 (mature) and shown as ratio of TAC/sham. Error bars represents standard error of mean (SEM) and * is p< 0.05, n = 3. (d) Neonatal myocytes cultured in growth-inhibited (serum free) conditions were stimulated with 100nM endothelin-1 or 10%FBS for 1hr or 24hrs, as indicated. Total RNA extracted was used for qPCR analysis of primary, pre- and mature miR-1. Error bars represents SEM, and * is p<0.05 and ** is p< 0.005. N = 3.

