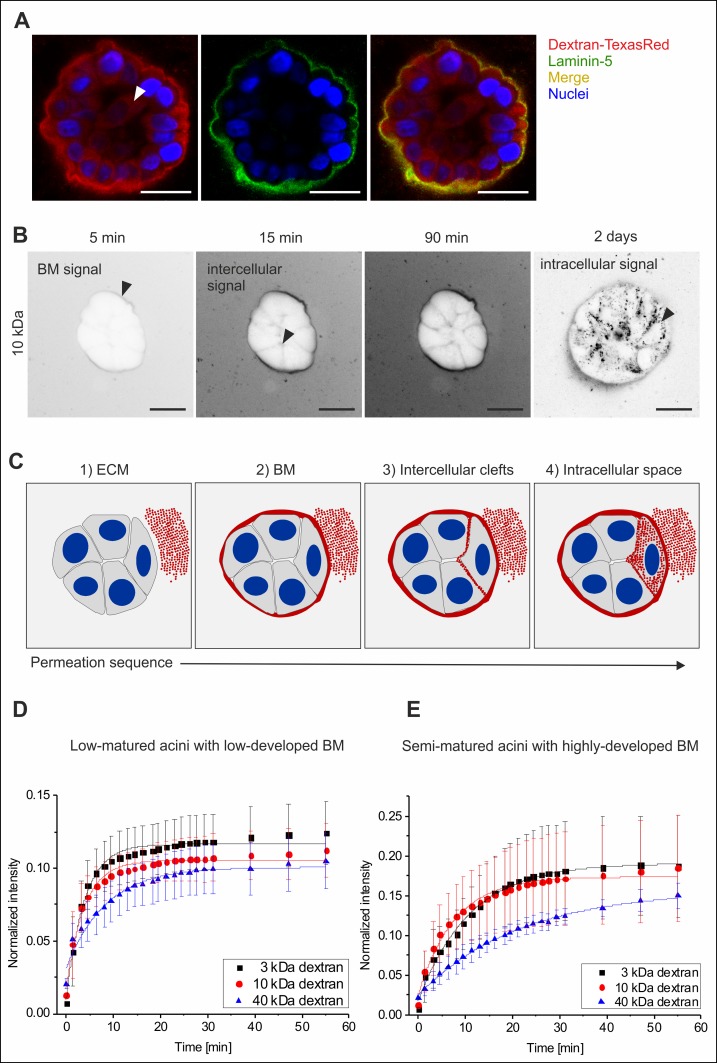
Fig 4. The basement membrane retards molecule influx into MCF10A acini.
A. Colocalization of the BM specific laminin-5 protein with dextran molecules demonstrated the accumulation of dextran within the BM scaffold. The white arrowhead indicates a cytoplasmic localization (after 2 days) of dextran tracer (40 kDa). B. Representative image sequence of in situ dextran permeation in MCF10A acini with highly-developed BM (EHS-matrix embedded). Black arrows indicate first temporal appearance and spatial localization of dextran (10 kDa) (contrast inverted). C. Principal time course of molecule influx through the BM into MCF10A acini. Red: dextran, grey cytoplasm, blue: nuclei. Scale bars = 20 μm. Plots illustrate a semi-quantitative analysis of dextran permeation. Average fluorescence intensity profiles are shown for (D.) acini with low-developed BM and with (E.) highly-developed BM. Data are normalized to the background plateau for each molecular weight (see S2 Fig). Mean values with s.d. are shown. Full lines represent fits to a semi-empirical law (see S1 Protocol). Please note that absolute signal intensities of low- and semi-matured acini are not directly comparable because increased autofluorescence imposed the use of an adapted masking algorithm for the semi-matured sample group.

