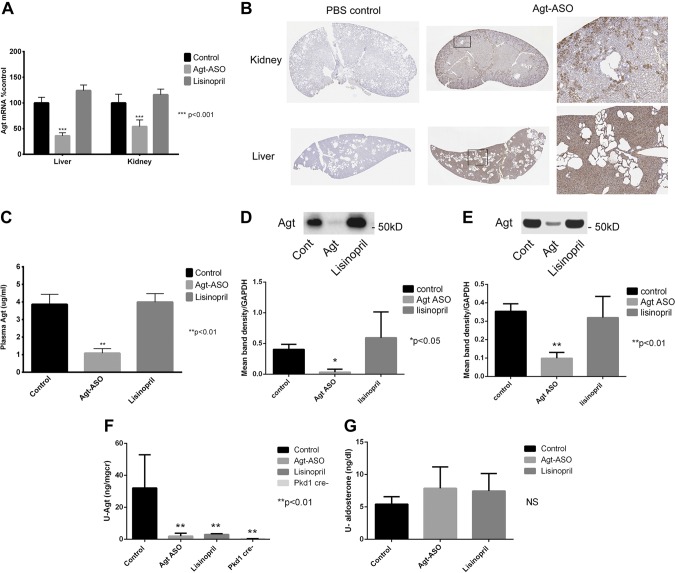
Figure 1.
A) Summary of Agt mRNA from liver and kidneys. Agt-ASO treatment (10 wk) significantly decreased Agt mRNA to 34% in the liver and 57% in the kidney compared with the control (100% ; Ribogreen normalized; n = 5–7). Agt mRNA of both the liver and kidney did not change with lisinopril or control treatment. B) Representative histology image stained with pan–anti-ASO antibody of kidney and liver obtained from Agt-ASO-treated and PBS control mouse. ASO staining (brown) was homogeneously dispersed throughout the hepatic tissue (bottom middle and right). Agt-ASO-stained predominantly in the kidney cortex (proximal tubules) and, to some extent, the medulla (top middle and right). Most cyst-lining cells lacked pan-ASO staining. PBS control kidneys showed no ASO staining (top and bottom left). Magnification: left and middle, ×1; right: ×6. C) Summary of plasma Agt concentration. Agt-ASO significantly suppressed plasma Agt concentration to 1.08 μg/ml, compared with control (3.86 μg/ml) and lisinopril (3.99 μg/ml) (n = 5– 7). D, E) Western blot analysis of liver and kidney Agt protein. Liver and kidney Agt proteins were both significantly suppressed in Agt-ASO-treated mice compared with lisinopril-treated or control mice (n = 4–6). F, G) Urinary Agt and aldosterone level by ELISA. Agt-ASO and lisinopril treatment significantly suppressed urinary Agt compared with control. Control: 32 ± 10 ng/mg; Agt-ASO: 1.9 ± 0.8 ng/mg; lisinopril: 3.0 ± 0.2 ng/mg; and Cre-negative: 0.35 ± 0.05 ng/mg. The 24 h urinary aldosterone level was not significantly different in the treatment groups.

