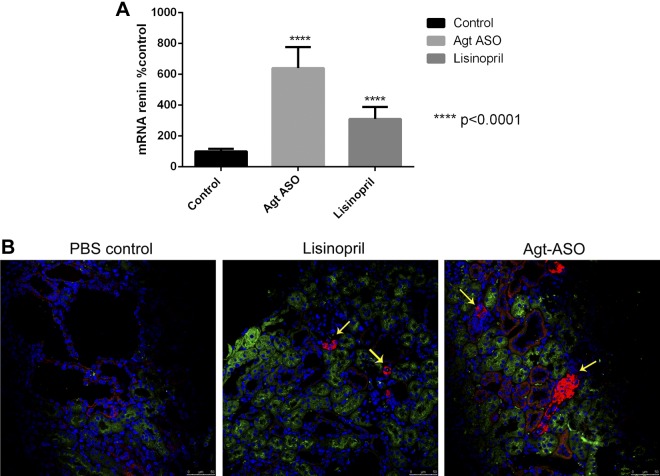
Figure 2.
A) Summary of renin mRNA from kidneys. There was a significant increase in renin mRNA in the kidneys treated with Agt-ASO (481 ± 92%) and lisinopril (314 ± 58%) compared with control group (4 mo kidneys). B) Representative immunofluorescence image of renin (red), LTL (green), and Hoechst (blue) from 4 mo kidneys. There was intense staining for renin at the juxtaglomerular apparatus (yellow arrow) in Agt-ASO- and lisinopril-treated but not in control kidneys. Magnification ×40.

