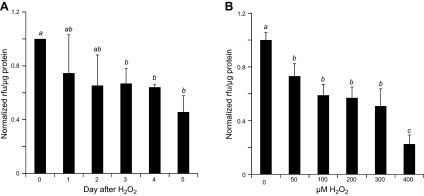
Figure 2.
Cells surviving H2O2 treatment show decreases in cellular content of functional mitochondria. Neonatal rat cardiomyocytes seeded in 6-well plates were treated with 300 μM for 2 h and assayed over a time course of 5 d (A) or were treated with various concentration of H2O2 for 2 h and cultured for 5 d (B). Cells were loaded with MitoTracker Orange CMTMRos for measurements of mitochondria membrane potential using a fluorescence plate reader. Fluorescence intensity was normalized to protein content from the corresponding well and expressed as the ratio of means ± sd from 3 independent experiments. The letter a indicates significant difference (P < 0.05) from means labeled with b or c as determined by 1-way ANOVA with Bonferroni correction. The mean labeled ab is not significantly different from that labeled with a or b, although a mean labeled with a is significant different from that labeled with b.

