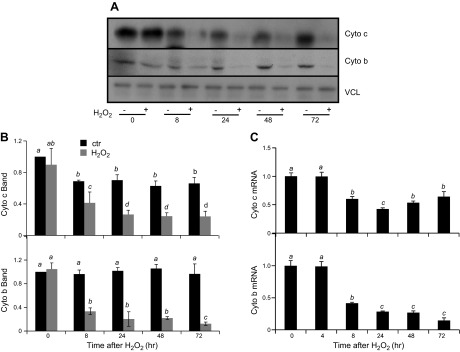
Figure 3.
H2O2 treatment causes decreases in expression of mitochondrial proteins over time. Neonatal rat cardiomyocytes were exposed to 300 μM H2O2 for 2 h and harvested at the indicated time points for Western blot (A, B) or real-time RT-PCR (C). The band intensity from Western blot was quantified using ImageJ software and normalized to the corresponding loading control VCL band for numeric presentation (B). The data represent the means ± sd from 3 independent experiments. The letter a indicates significant difference (P < 0.05) from means labeled with a letter b, c, or d as determined by 1-way ANOVA with Bonferroni correction. The mean labeled ab is not significantly different from that labeled with a or b, although a mean labeled with a is significant different from that labeled with b.

