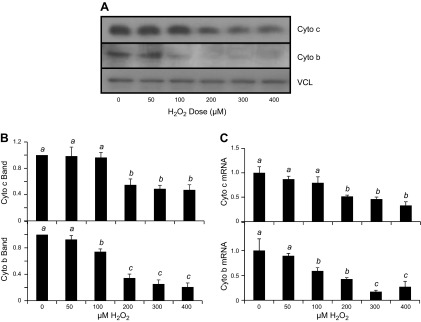
Figure 4.
H2O2 dose-dependent decrease of mitochondrial protein expression. Neonatal rat cardiomyocytes were exposed to H2O2 at the concentration indicated for 2 h before harvesting at 48 h after for measurements of cytochrome c or cytochrome b protein by Western blot (A, B) or mRNA by real-time RT-PCR (C). The band intensity from Western blot was quantified using ImageJ software and normalized to the corresponding loading control VCL band for numeric presentation (B). The data represent the means ± sd from 3 independent experiments. A letter a indicates significant difference (P < 0.05) from means labeled with a letter b or c as determined by 1-way ANOVA with Bonferroni correction.

