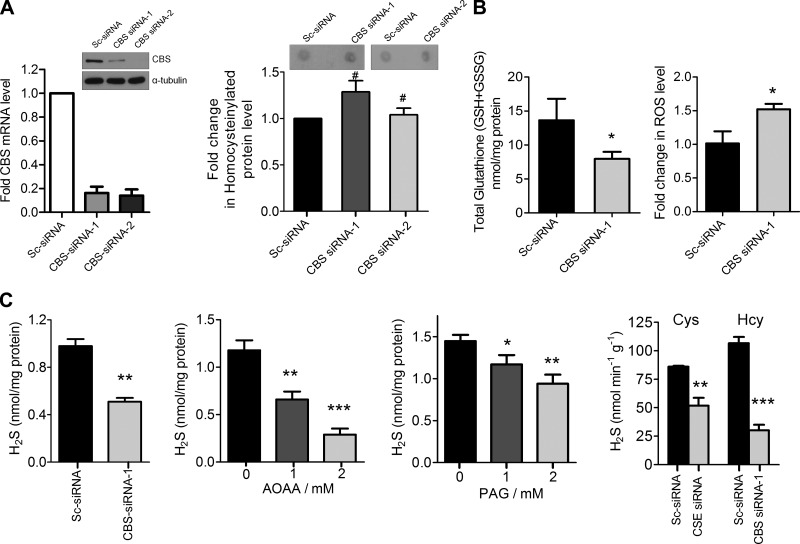
Figure 2.
Silencing CBS alters metabolite levels. A) Left panel: ImageJ quantification of the relative levels of Hcy by dot blot analysis for homocysteinylated protein levels in lysates of scrambled siRNA, CBS siRNA-1 and CBS siRNA-2-treated HUVECs after 48 h transfection. A total of 20 µg of lysate was used for dot blot analysis to detect homocysteinylated proteins and the intensities were quantified using NIH ImageJ. Efficiency of CBS knockdown was estimated by immunoblotting (middle panel) and (right panel) qRT-PCR analysis 48 h posttransfection. Data represent means ± sd, n = 3. #P > 0.05 (not significant). B) Change in total glutathione [GSH + glutathione disulfide (GSSG)] level and ROS (dichloro-dihydro-fluorescein diacetate assay-flow cytometry) in CBS siRNA-treated HUVECs compared with scrambled control siRNA-treated cells after 48 h transfection. C) First panel, from left: H2S levels in scrambled and CBS siRNA-treated HUVECs determined by methylene blue assay 48 h posttransfection; second panel, with various doses of AOAA determined by methylene blue assay 24 h posttreatment; third panel, with various doses of PAG determined by methylene blue assay 24 h posttreatment; and fourth panel, CBS and CSE activity assay using Hcy (for CBS) and cysteine (for CSE) as substrates in CBS- and CSE-silenced HUVECs, respectively, determined by methylene blue assay 48 h posttransfection. Data represent means ± SD (n = 3), 1-way ANOVA. *P ≤ 0.05, **P ≤ 0.01, ***P ≤ 0.001.

