Figure 1.
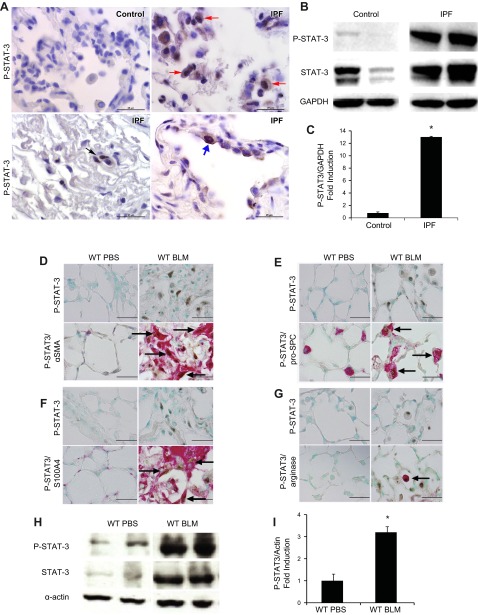
Characterization of STAT-3 activation in human patients with IPF and the BLM model. A) Immunolocalization of phospho-STAT-3 (P-STAT-3) expression on alveolar fibroblasts (black arrows), alveolar macrophages (red arrows), and AECs (blue arrows) in lung sections from healthy control and patients with severe IPF. Images are representative of 4 patients from each group. B) Western blot analysis of phospho-STAT-3 expression in human patients with mild and severe IPF. STAT-3 and GAPDH were used as controls (n ≥ 4). *P ≤ 0.05 control vs. IPF. C) Phospho-STAT-3 band intensity was quantified using ImageJ analysis. Values are presented as the percentages of GAPDH ± sem (n ≥ 4). *P ≤ 0.05 control vs. IPF. Coimmunolocalization expression of phospho-STAT-3 and α-SMA (D), pro-SPC (E), S100A4 (F), and arginase (G) in lung sections from wild-type mice treated with PBS and BLM. Images are representative of 8 mice from each group. Scale bars, 50 μm. H) Western blot analysis using an antibody against phospho-STAT-3 in whole-lung lysates. STAT-3 and α-actin were used as controls. I) Phospho-STAT-3 band intensity was quantified using ImageJ analysis. Values are presented as the percentages of α-actin ± sem (n ≥ 4). *P ≤ 0.05 PBS vs. BLM. Arrows in D–G identify the phospho-STAT3-positive cells.

