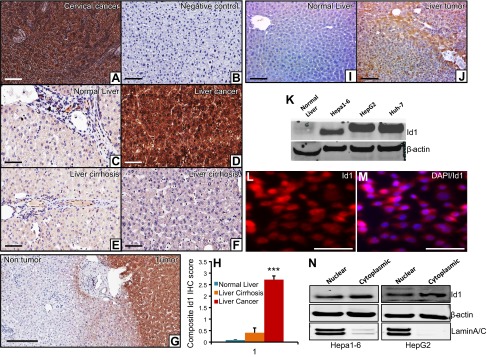
Figure 1.
Id1 is strongly expressed in liver tumors. A) As a known positive control, a cervical cancer specimen that shows strong Id1 expression was used. B) As an experimental negative control, the antigen-binding site of the Id1 antibody was blocked by a specific blocking peptide. C) Normal liver section displays weak expression of Id1. D) Strong intense expression of Id1 in liver cancer specimen. E and F) Weak-to-moderate Id1 expression was detected in liver cirrhotic samples. Images were captured using the Olympus BX43X (Tokyo, Japan) at 200× magnification. G) Representative Id1 IHC staining photograph displays strong intense staining of Id1 in the human liver tumor tissue and very weak-to-no staining in the surrounding nontumorous tissue. H) Id1 expression was determined semiquantitatively by assessing the percentage of tumor cells and the staining intensity. Two pathologists analyzed all slides, and the percentage of tumor cells stained for Id1 was documented. Intensity of staining was graded as absent (0), weak (1), moderate (2), and strong (3). The percentage of positive cells was counted in a range of 0–100%. The product of the 2 scores was calculated as a composite Id1 IHC score. All the liver cancer cases showed strong (3+) expression of Id1 (n = 20) (D). In the cirrhotic livers, 10–85% of cells showed weak (1) staining for Id1 (n = 8 (E and F). In the normal liver sections, 5–10% of cells displayed weak (1) staining for Id1 (n = 8) (C). A comparison of Id1 expression in these 3 groups was shown as a composite Id1 IHC score. I and J) Representative photographs show no detectable Id1 expression in normal mouse liver (I) and strong Id1 expression in a liver tumor (n = 6) (J). K) Western blot shows the expression level of Id1 and β-actin in normal mouse liver and in 3 HCC cell lines. L and M) Immunocytochemical staining of Id1 in Hepa1-6 cells shows strong nuclear as well as some cytoplasmic staining. N) Western blot shows the expression level of Id1 in the nuclear and cytoplasmic compartments of Hepa1-6 and HepG2 cell lines. β-Actin is used as a loading control that is present in both compartments, whereas Lamin A/C was used as a protein fractionation quality control because it is present only in the nucleus. Scale bars, 200 µm (A–G, I, and J) and 100 µm (L and M).

