Figure 3.
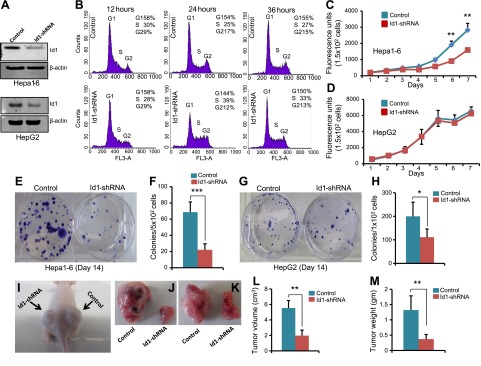
Id1 knockdown suppresses in vitro colony formation and in vivo tumor growth. A) Western blot shows the expression level of Id1 and β-actin in control and Id1-knockdown (Id1-shRNA) Hepa1-6 and HepG2 cells. B) Cell cycle profiles of Hepa1-6 cells measured by fluorescence-activated cell sorting (FACS) analysis. Id1 was knocked down by shRNA in Hepa1-6 cells. Fully confluent P2 cells were split into 1–3 plates, and the cell cycle profiles were measured by propidium iodide staining followed by FACS analysis at the indicated time points in control and Id1-shRNA cells. C and D) Line graphs show the overall proliferation rate of Hepa1-6 and HepG2 control and Id1-shRNA cells measured by AlamarBlue proliferation assay. E) Representative pictures of crystal violet-stained colonies formed by control and Id1-shRNA Hepa1-6 cells. F) Average number of colonies formed by control and Id1-shRNA Hepa1-6 cells. G) Representative pictures of crystal violet-stained colonies formed by control and Id1-shRNA HepG2 cells. H) Average number of colonies formed by control and Id1-shRNA HepG2 cells. I–K) Representative photographs show subcutaneous xenograft growth in nude mice (I) and the isolated tumors on d 15 (J and K). Control or Id1-shRNA Hepa1-6 cells (3 × 10⁶) were injected subcutaneously into 7-wk-old nude mice. L and M) Bar graphs show tumor volume (L) and weight (M) on d 15 (n = 5). Experiments were done in triplicates and repeated 3 times. *P < 0.05; **P < 0.005; ***P < 0.0005.

