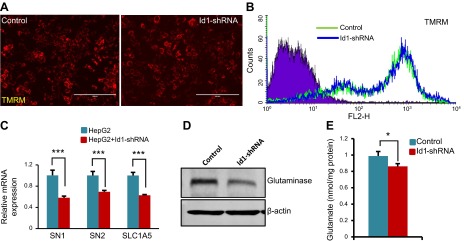
Figure 5.
Reduced expression of glutamine receptors and glutamate production in Id1-knockdown cells. A) Representative TMRM-stained fluorescent mitochondrial images of control HepG2 and Id1-shRNA knockdown HepG2 cells. Scale bar, 100 μm. B) Fluorescence-activated cell sorting analysis of unstained HepG2 cells (violet) and TMRM-stained control and Id1-shRNA knockdown HepG2 cells. C) mRNA levels of indicated genes in control and Id1-shRNA HepG2 cells. D) Western blot shows the expression level of GLS and β-actin in control and Id1-knockdown HepG2 cells. E) Bar graph displays the levels of glutamate in control and Id1-shRNA HepG2 cells. Expression data are means ± sd (n = 3). *P < 0.05; ***P < 0.0005.

