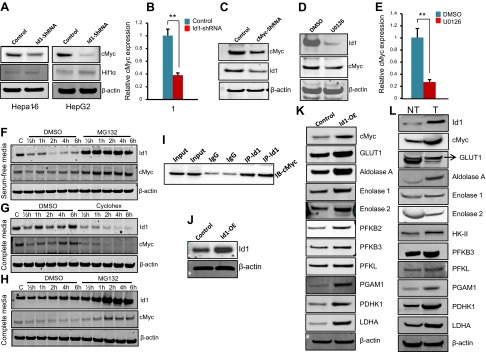
Figure 6.
Id1 knockdown leads to down-regulation of c-Myc. A) Western blot analysis of c-Myc and HIF1α in control and Id1-shRNA Hepa1-6 and HepG2 cells. β-Actin was used as loading control. B) mRNA levels of c-Myc in control and Id1-shRNA HepG2 cells. C) Western blot shows the protein levels of c-Myc and Id1 in control and c-Myc-shRNA HepG2 cells. D) Western blot shows the protein levels of Id1 and c-Myc in DMSO- or U0126-treated HepG2 cells. E) mRNA levels of c-Myc in DMSO- or U0126-treated cells. F) Western blot shows the protein levels of Id1 and c-Myc in DMSO- or MG132-treated HepG2 cells in serum-free medium. G) Western blot shows the protein levels of Id1 and c-Myc in DMSO- or cycloheximide (cyclohex)-treated HepG2 cells in complete medium. H) Western blot shows the protein levels of Id1 and c-Myc in DMSO- or MG132-treated HepG2 cells in complete medium. I) Coimmunoprecipitation followed by Western blot shows a direct interaction between Id1 and c-Myc. Ten percent immunoprecipitation reaction was used as input. J) Western blot analysis of Id1 and β-actin in control and Id1-overexpressed Hepa1-6 cells. K) Western blot analysis of indicated proteins in control and Id1-overexpressed Hepa1-6 cells. L) Representative Western blots show the expression pattern of indicated proteins in mouse nontumorous (NT) and liver tumor (T) tissues (n = 3). Expression data are means ± sd (n = 3). **P < 0.005.

