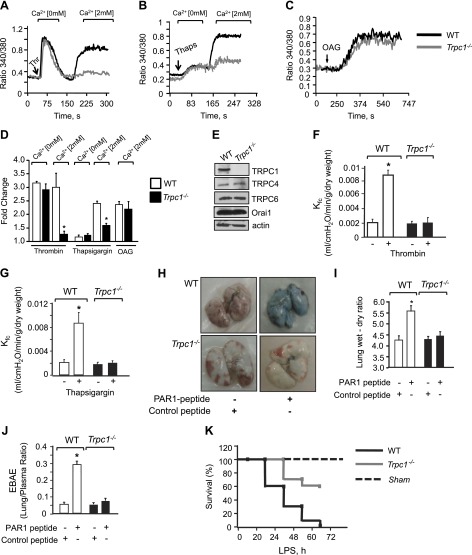
Figure 2.
Loss of TRPC1 impairs vascular permeability in vivo. Intracellular Ca2+ in response to thrombin (A) or thapsigargin (B) in Ca2+-free medium followed by re-addition of 2 mM extracellular Ca2+ to activate Ca2+ entry. C) Cells were activated using OAG in presence of 2 mM Ca2. Each representative tracing is average response of 20 to 25 cells. D) Plot showing means ± sd of fold change in steady-state intracellular Ca2+ after addition or without addition of extracellular Ca2+ in presence of indicated agonists; n = 4/group. *Values different from WT ECs; P < 0.05. E) Immunoblot showing expression of channels in WT or TRPC1-null cells using appropriate antibodies. Immunoblot with anti-actin antibody was used as loading control. Immunoblot represent data from multiple experiments. F, G) Kf,c in WT or Trpc1−/− mice lungs after perfusion with 10 µM PAR-1 agonist peptide (F) or 2 µM thapsigargin (G). Plot shows means ± sem from 3 to 4 individual experiments. *Significant increase in Kf,c; P < 0.05. H–J) Lung vascular permeability in response to PAR-1 agonist (1 mg/kg) or control peptide as determined by EBAE from lungs vs. plasma (H, I) and lung wet–dry ratio (J). H) Representative image of PAR-1-induced Evans blue accumulation in lungs. I and J) Means ± sem of changes in EBAE and lung edema from 3 to 4 individual experiments. *Significant increase from control peptide group. J) Mice were challenged intraperitoneally (40 mg/kg body weight) with LPS, and their survival was assessed by log-rank test, n = 10.

