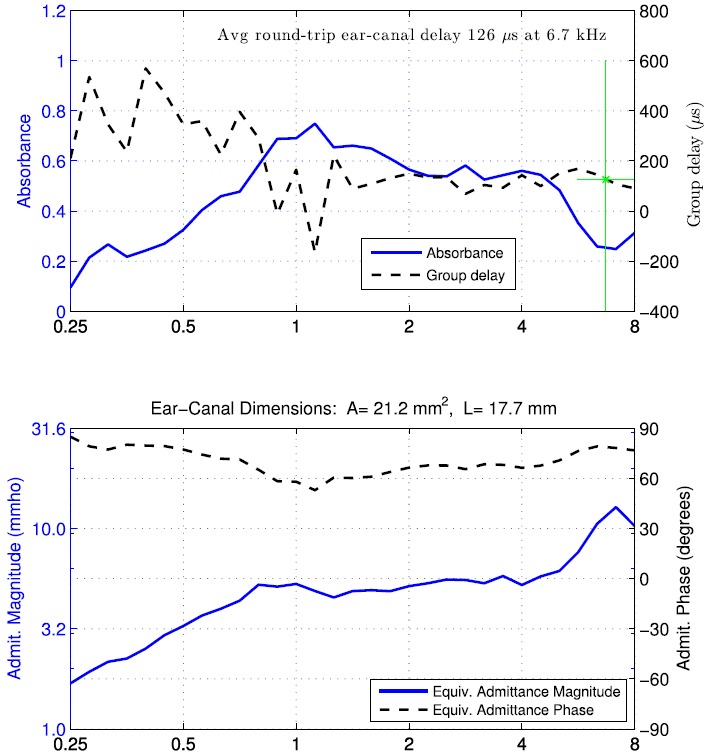
FIG. 1.

(Color online) Normal adult ear A. Top: Ambient absorbance (solid curve, left ordinate) and group delay Dp (dashed curve, right ordinate). A vertical bar identifies a critical frequency fmin above 2 kHz (equal to 6.7 kHz) with minimum absorbance. The group delay value displayed in text is the average over the half octave centered at that frequency. A horizontal bar is drawn at this average group delay value over the half octave range centered at that frequency. Bottom: Equivalent TM admittance magnitude (solid line, left ordinate) and phase (dashed line, right ordinate). Acoustic estimates of ear-canal area and length between probe and TM displayed on top of the panel.
