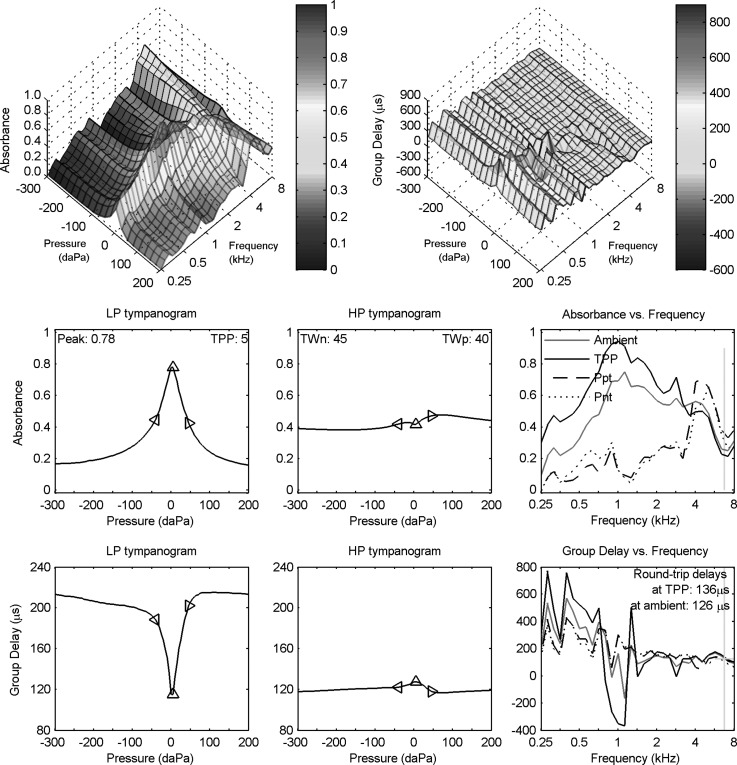
FIG. 3.
(Color online) Wideband downswept reflectance tympanogram for adult ear A. Row 1: absorbance (left) and group delay Dp (right) tympanograms versus frequency and air pressure. Row 2: LP (left) and HP (middle) filtered absorbance tympanograms versus air pressure, with peak absorbance and TPP values in left panel and half-tympanometric widths TWn and TWp of the LP tympanogram in the middle panel. Row 2 (right): absorbance tympanogram versus frequency at TPP, Ppt, and Pnt compared to ambient absorbance replotted from Fig. 1. Row 3: LP (left) and HP (middle) filtered group-delay tympanograms versus air pressure. Row 3 (right): Tympanometric group delay at TPP, Ppt, and Pnt compared to ambient group delay replotted from Fig. 1 (top). A vertical bar in each right panel of rows 2 and 3 identifies the critical frequency (6.7 kHz) of The diamond markers in each left and middle panel of rows 2 and 3 show air pressure at TPP, TPP − TWn, and TPP + TWp.

