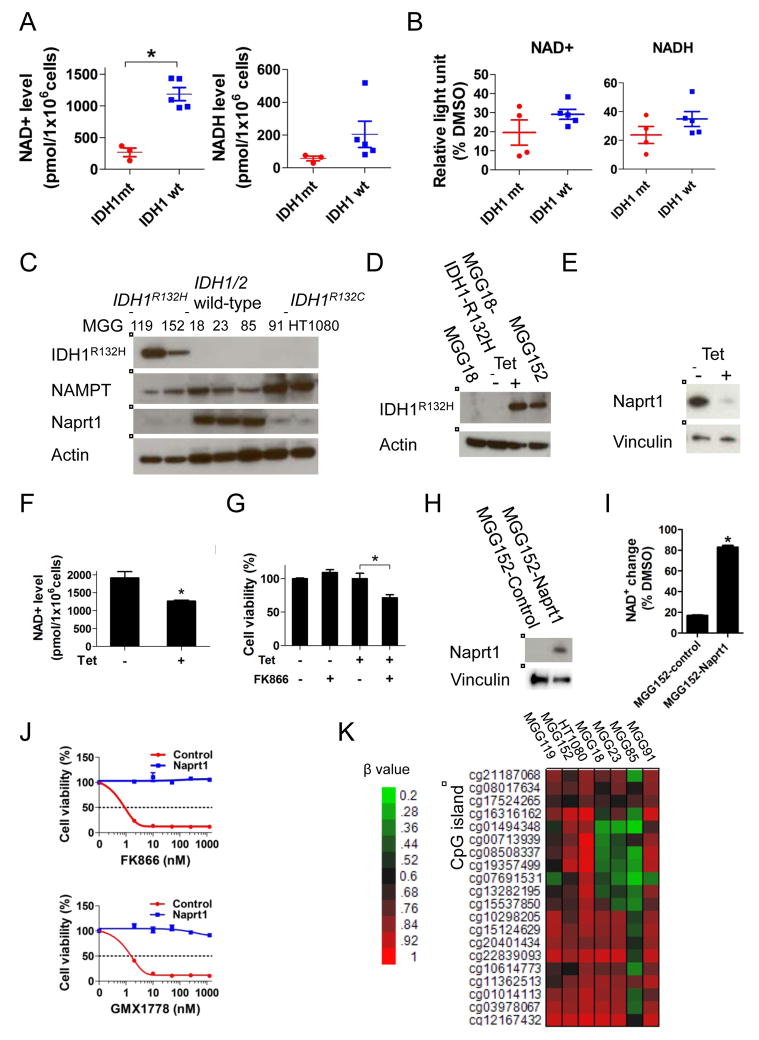
Figure 4. IDH1 mutation reprograms NAD+ metabolism.
(A) Scatter plots of absolute NAD+ (left panel) and NADH (right panel) levels in a panel of glioma tumorsphere lines. (B) Relative NAD+ and NADH decrease after FK866 (12.5 nM, 24 hr) treatment of the lines in panel A compared to DMSO control (24 hr). (C) Western blot analysis of IDH1R132H, NAMPT and Naprt1. Actin, loading control. (D) and (E) Western blot analysis of MGG18 (IDH1/2 wild-type) engineered with a tetracycline (tet)-inducible IDH1R132H gene (MGG18-IDH1-R132H). MGG18-IDH1-R132H was incubated +/− tet for 2 months in vitro, then harvested for analysis. Actin, Vinculin, loading controls. (F) NAD+ levels of MGG18-IDH1-R132H cells +/− tet induction for 2 months. (G) Cell viability assay of MGG18-IDH1-R132H cells +/− tet induction for 2 months followed by +/− FK866 (12.5nM, 5 days). (H) Western blot analysis of MGG152 infected with lentivirus carrying no (MGG152-control) or Naprt1 cDNA (MGG152-Naprt1). Vinculin, loading control. (I) Relative NAD+ change after FK866 treatment (12.5 nM, 24 hr) in MGG152-control and MGG152-Naprt1 compared to DMSO control (24 hr). (J) Cell viability assay of MGG152-control and MGG152-Naprt1 after 48 hr incubation with FK866 or GMX1778. (K) Heatmap of NAPRT1 promoter DNA methylation status in IDH1 mutant (MGG119, MGG152 and HT1080) and IDH1/2 wild-type (MGG18, MGG23, MGG85 and MGG91) lines measured by Infinium arrays. β values represent the fraction of methylated CpG site. Data were acquired by Infinium HumanMethylation 450 BeadChip array. Bars, +/− SEM, * p<0.05. See also Figure S2.

