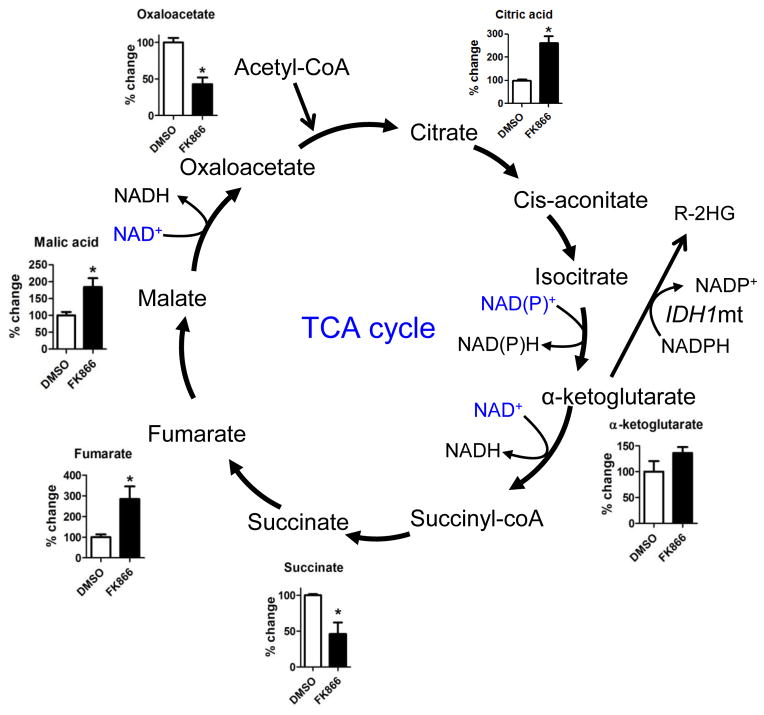
Figure 5. NAMPT inhibitor effect on NAD+-utilizing pathways in IDH mutant cancers.
Metabolites of the tricarboxylic acid (TCA) cycle in MGG152 cells were quantified by LC-MS after treatment with DMSO (36 hr, white bars) or FK866 (12.5 nM, 36 hr, black bars). Bar graphs represent the changes in FK866-treated cells relative to DMSO control.

