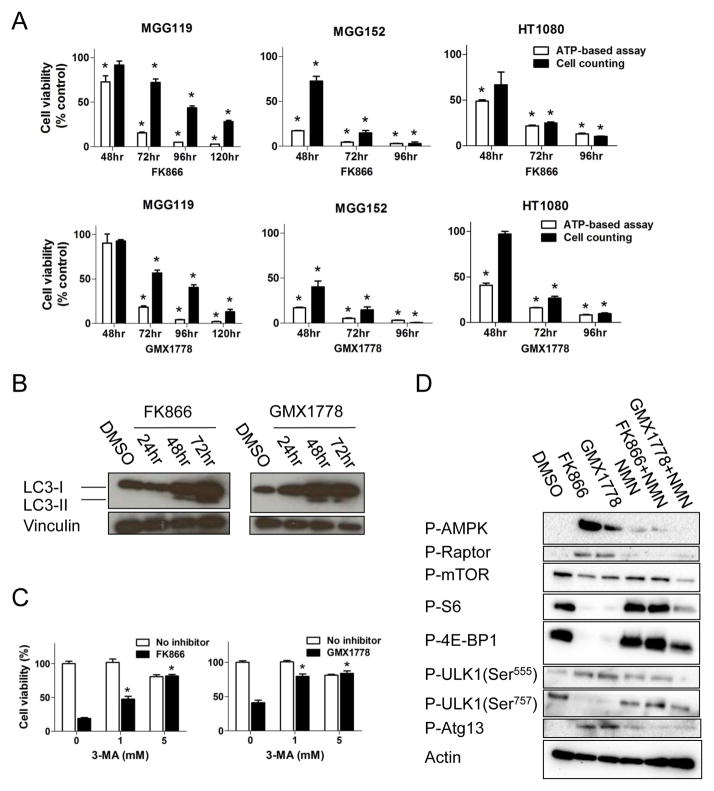
Figure 6. NAD+ depletion triggers AMPK-initiated autophagy and cell death in IDH1 mutant cancer cells.
(A) Relative cell viability of cells treated with FK866 (upper row) and GMX1778 (lower row) measured by CellTiter-Glo (white bars) and viable cell count (Trypan blue exclusion assay, black bars) compared to DMSO controls. (B) Western blot analysis of LC3-I and LC3-II expression in MGG152 cells after treatment with FK866 (12.5 nM) and GMX1778 (12.5 nM) compared to DMSO control (72 hr). Vinculin, loading control. (C) Cell viability assay (CellTiter-Glo) of MGG152 cells treated for 72 hr with FK866 (12.5 nM, left), GMX1778 (12.5 nM, right), or DMSO +/− autophagy inhibitor 3-methyladenine (3-MA). Bars, +/− SEM, * p<0.05. (D) Western blot analysis of MGG152 cells treated with DMSO (48 hr), FK866 (12.5 nM, 48 hr), GMX1778 (12.5 nM, 48 hr) and NMN (100 μM, 48 hr) alone and in combinations as indicated. Actin, loading control. See also Figure S3.

