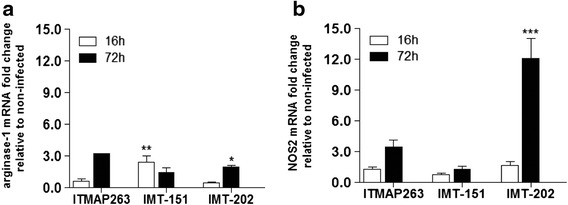
Fig. 1.

Arg1 and Nos2 expression profiles in macrophages infected with different L. infantum strains. The expression of Arg1 (a) and Nos2 (b) was measured by qRT-PCR in murine peritoneal macrophages after 16 and 72 h of infection with L. infantum ITMAP-263, IMT-151 or IMT-202 strains. Non-infected macrophages processed at the referred time points were used as control. Each sample was normalized to Hprt gene, calculated by the comparative CT method (2-ΔΔCT) and the ratio between mRNA levels in infected and non-infected cells is depicted. The graph corresponds to one representative experiment out of three. Statistic analysis was performed using one-way ANOVA with Bonferroni post-hoc test. * p < 0.05; ** p < 0.01; *** p < 0.001 relative to non-infected macrophages
