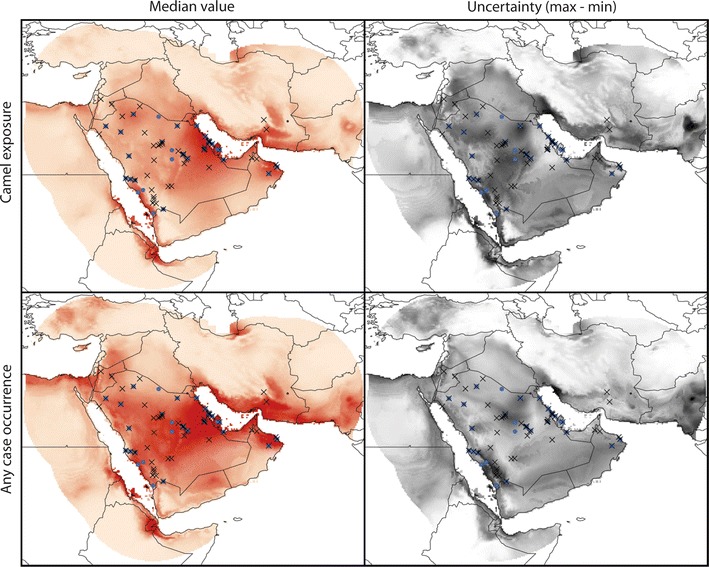
Fig. 2.

Visualization of ecological niche model outputs in terms of median prediction of suitability for MERS-CoV transmission to humans (left column; light orange low suitability, dark orange high suitability), and the uncertainty associated with those predictions estimated as the range of suitability values (pixel by pixel) among the 10 bootstrapped random replicate models (right column; white low uncertainty, black high uncertainty). Dots represent camel-exposed cases; X’s represent any case occurrence
