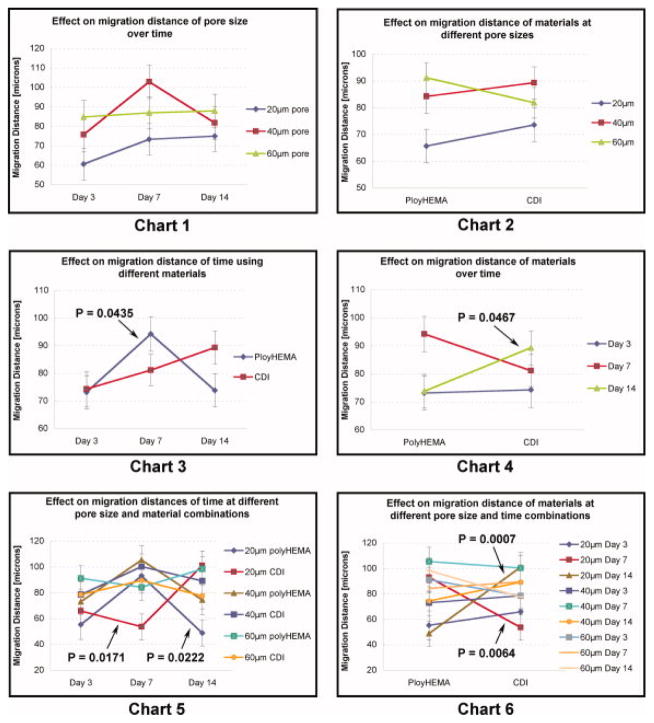
Figure 4.
Chart 1) Line chart compares the effect on migration distance that 20, 40 or 60μm pore sizes exhibit over time. Chart 2) Line chart shows the effect that poly(HEMA) or CDI modified poly(HEMA) material has comparing rods with 20, 40 or 60μm pore sizes. Chart 3) Line chart shows the effect on migration distance of poly(HEMA) and CDI modified poly(HEMA) over time. Chart 4) Line chart shows the effect on migration distance of healing time of 3, 7 and 14 days comparing poly(HEMA) and CDI modified poly(HEMA). Chart 5) Line chart shows the effect on migration distance of pore size/material combinations over time. Chart 6) Line chart shows the effect on migration distance of pore size/time combinations comparing poly(HEMA) and CDI modified poly(HEMA). Error bars depict standard error and P values less than 0.05 are indicated by arrows.

