
FIG. 4.
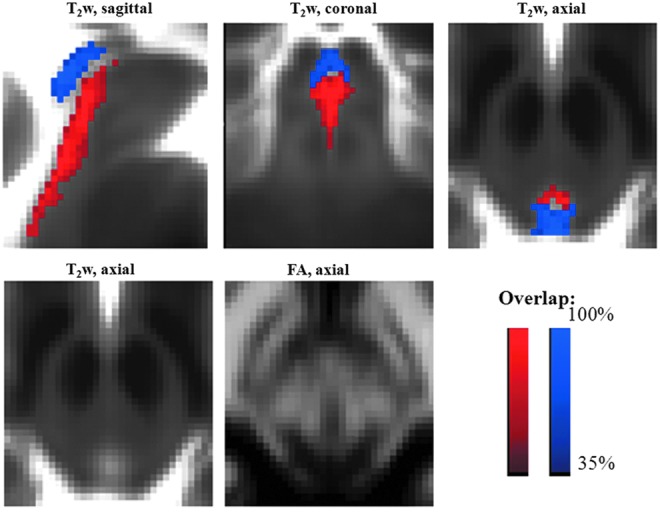
Probabilistic labels in MNI space of PAG and DR. Overlaid on the group average T2-weighted image (n=12) in IIT MNI space, probabilistic labels of the PAG (blue) and the DR (red) are shown. The PAG and the DR displayed similar T2-weighted signals (see, for example, in the bottom left panel the hypointense ring around the aqueduct of Sylvius) and differed by the level of FA (see bottom central panel), with the DR having a higher FA than the PAG, likely due to a higher content of oriented microstructures. The same coordinate system for sagittal (midline slice), coronal, and axial images as in Figure 3 is used (this is also the case for Figs. 5 and 6).