
FIG. 5.
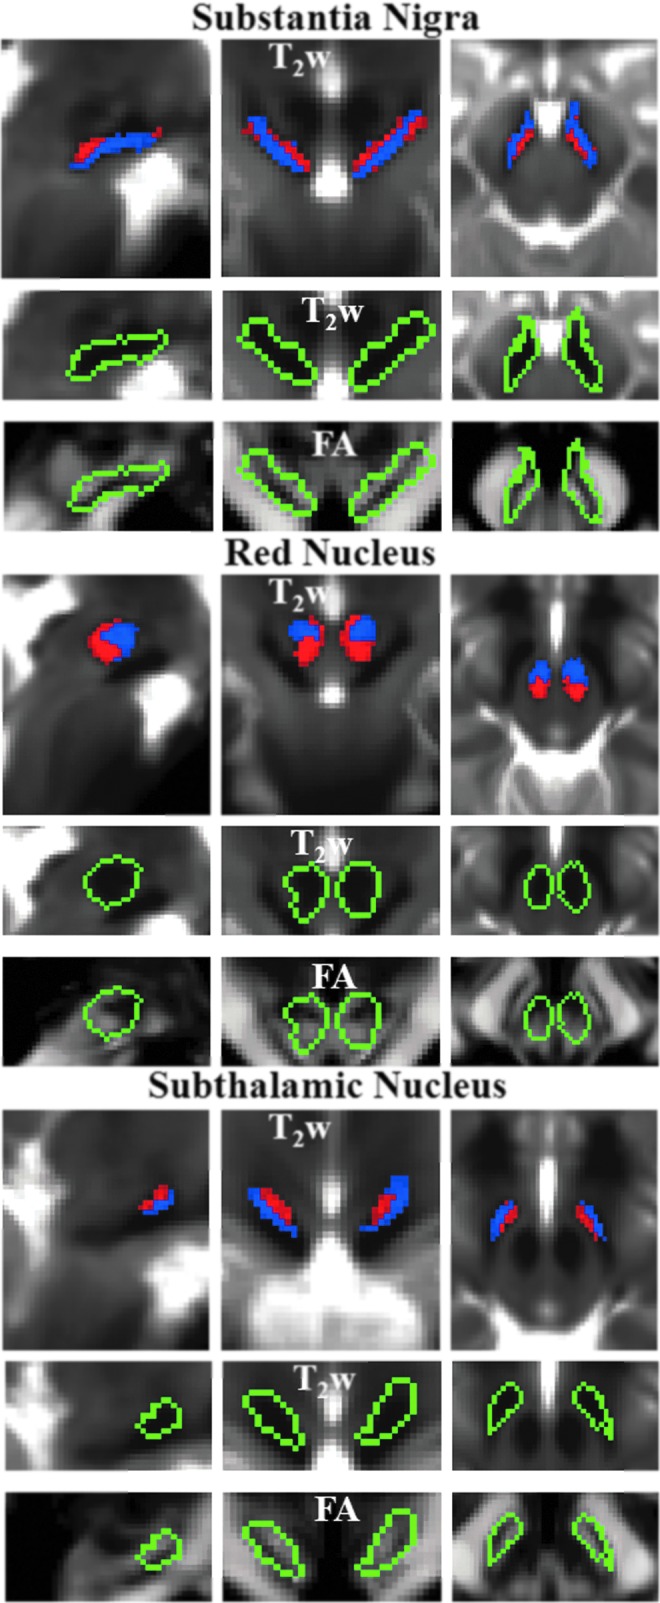
Probabilistic labels in MNI space of SN, RN, and STh. For each nucleus, we show: the probabilistic labels of two identified subregions (subregion 1/2=blue/red color, % overlap as in Fig. 4), overlaid on the group average T2-weighted image (n=12) in IIT MNI space on the top row panels; the contour plot (green) surrounding both subregions overlaid on the T2-weighted signal (zoomed view) in the middle row panels, and on the FA maps (zoomed view) in the bottom row panels. For each nucleus, the two subregions displayed similar T2-weighted signals but different diffusion FA values (subregion 1/2 having lower/higher FA values within each region). The two subregions of SN corresponded anatomically to SN pars reticulata (SNR) and pars compacta (SNC).