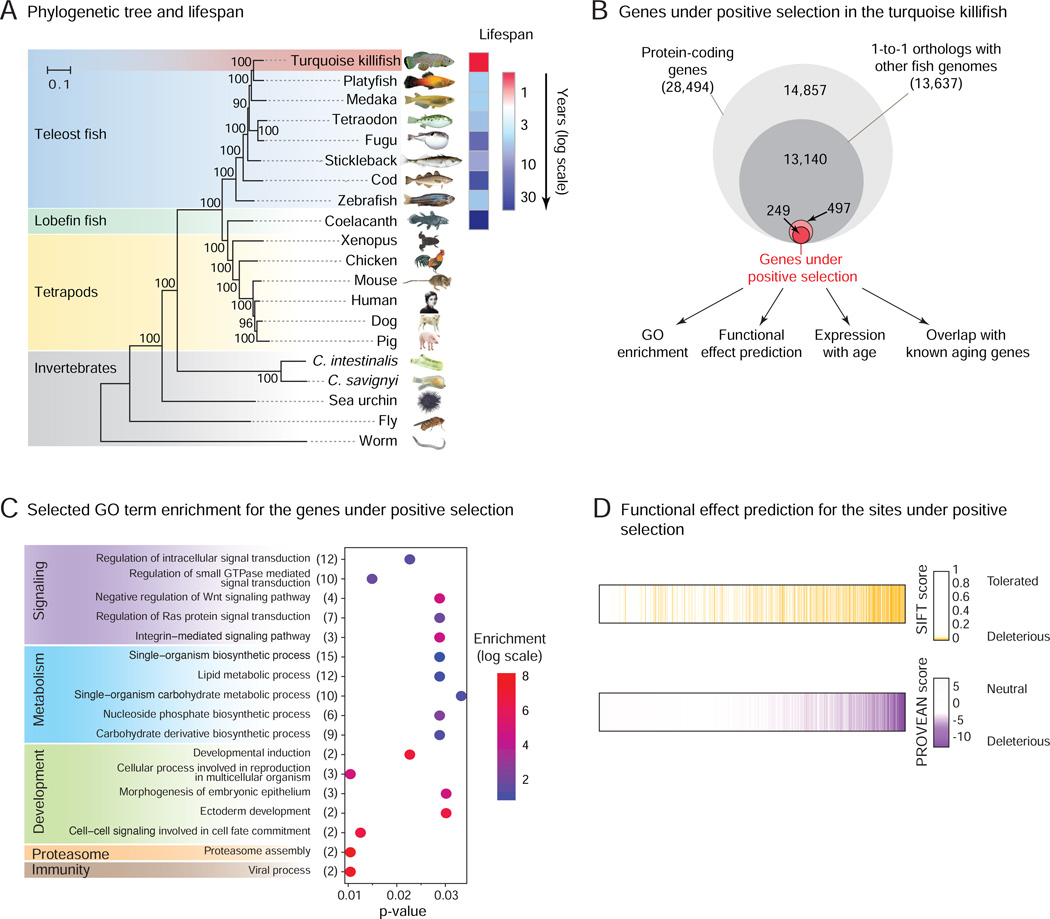
Figure 3. Evolutionary analysis of the turquoise killifish genome.
A) Phylogenetic tree of 20 animal species, including the turquoise killifish, based on 619 one-to-one orthologs (Table S2C). Number on nodes: level of confidence (% bootstrap support). Scale bar: evolutionary distance (substitution per site). Maximum lifespan data are from our experimental data (turquoise killifish) or from the AnAge database (other fish species), and represented as a heat map.
B) Proportion and analysis of the genes under positive selection in the turquoise killifish compared to 7 other fish species after multiple hypothesis correction (FDR < 5%). See also Figure S3A.
C) Selected GO term enrichment for the genes under positive selection in the turquoise killifish. The number of genes associated with each category is indicated in brackets after the term description, and enrichment values are indicated in colored scale. See also Table S3C.
D) Predicted functional effect on the protein of residues under positive selection in the turquoise killifish have based on SIFT (top row) and PROVEAN (bottom row). Residues are ordered from left to right based on the rank-product of the SIFT and PROVEAN scores. Only sites scored by both methods are displayed. See also Figure S3B, Table S3D, and S4G.

