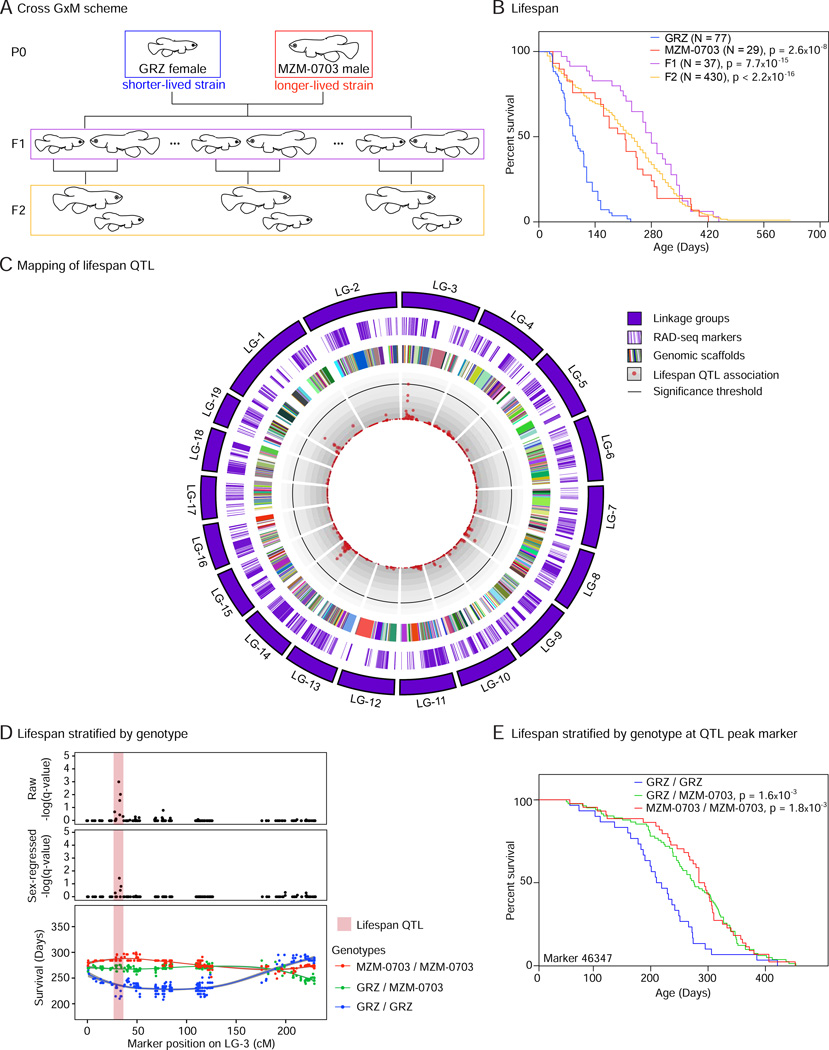
Figure 6. Genetic architecture of lifespan using a cross between shorter-lived and longer-lived strains of the turquoise killifish.
A) Scheme of cross GxM. A female from the shorter-lived GRZ strain was crossed with a male from the longer-lived MZM-0703 strain (P0) to generate F1 progeny. F1 individuals were mated to generate F2 progeny.
B) Lifespan of the parental strains, F1, and F2 progeny of cross GxM in the captive conditions used in this study (pooled males and females). p-values for differential survival compared to GRZ individuals in Log-Rank tests are indicated. See Table S6A for complete statistics.
C) Circos plot representing the linkage map of cross GxM and association of markers with lifespan by quantitative trait locus (QTL) analysis. The linkage map is composed of 19 linkage groups (LG). The association of each RAD-seq marker with differences in lifespan is represented as –log10 of the Random Forest Analysis q-value (red dots). The 5% FDR significance threshold is denoted by a black line. There is one marker above this threshold in LG-3 (lifespan QTL). Genomic scaffold length is scaled to genetic distance (cM) and not physical distance (bp).
D) The lifespan QTL is non-transgressive. Upper panel: Raw −log10 (Random Forest Analysis q-value) for association of markers to individual fish lifespan. Middle panel: −log10 of the Random Forest Analysis q-values for association of markers to lifespan after sex regression to account for the possible effect of sex as a confounding variable. Bottom panel: Survival stratified by genotype associated with each marker on LG-3. Homozygotes with alleles coming from the long-lived MZM-0703 grandparent (red) exhibit highest survival at the ~35cM position on LG-3, whereas homozygotes with alleles coming from the short-lived GRZ grandparent (blue) exhibit lowest survival. Light red rectangle: lifespan QTL region.
E) Lifespan of fish with different genotypes at the marker that is most significantly associated to the lifespan QTL (RAD-seq marker 46347). p-values for differential survival compared to individuals with the GRZ/GRZ genotype in Log-Rank tests are indicated. See also Table S6B for complete statistics.

