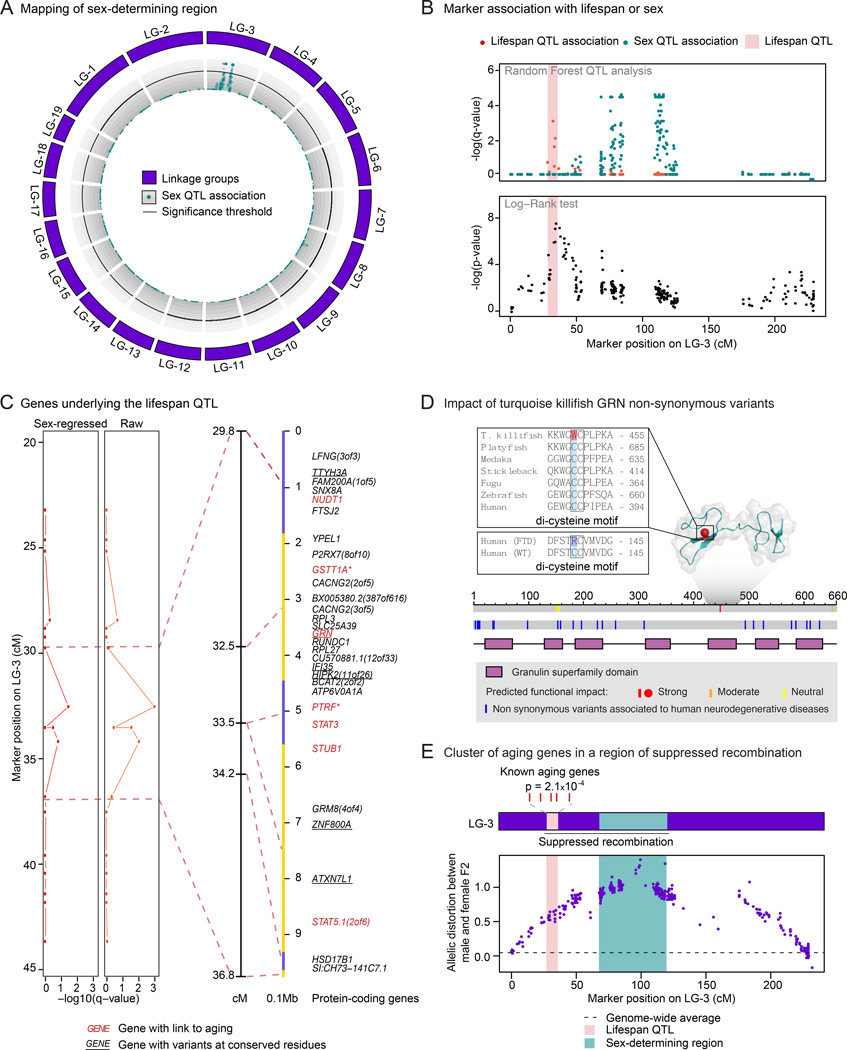
Figure 7. The lifespan QTL is linked to the sex-determining region and contains a cluster of aging genes.
A) Circos plot representing the association of markers with sex by QTL analysis in cross GxM. The association of each RAD-seq marker with sex is represented as −log10 of the Random Forest Analysis q-value (turquoise dots). The 5% FDR significance threshold is denoted by a black line. There is a cluster of markers above this threshold in LG-3 (sex-determining region).
B) The lifespan QTL is distinct from the sex-determining region. Upper panel: Random Forest analysis for marker association with lifespan (red) or sex (turquoise). Lower panel: Log-Rank survival analysis in the F2 generation of cross GxM between homozygotes with alleles coming from GRZ grandparent vs. the MZM-0703 grandparent at each marker. Light red rectangle: Lifespan QTL region.
C) Identification of the genes underlying the lifespan QTL on LG-3. Left panels: Sex-regressed or raw −log10 of the Random Forest Analysis q-value for association with lifespan. Dashed lines delimit the lifespan QTL. Right panels: lifespan QTL region on LG3 and corresponding anchored genomic scaffolds in alternating yellow and slate blue colors. Markers are linked to the mid-points of the scaffolds. Genes in red have been previously linked to aging in the GenAge database (human and mouse combined, Table S4A) or manually curated from the literature (asterisks, Table S7A). Underlined genes have non-synonymous variants at evolutionary-conserved residues. See also Figure S7B–S7G.
D) Location of residues with putative functional consequences and associated to human neurodegenerative diseases on GRN in the turquoise killifish. Color represents the strength of functional impact. Top panel: NMR structure of human orthologous domain. Grey shadow: GRN domain with available NMR structure. Top insert: alignment of the residue with strong functional effect W449 in the turquoise killifish with other species (see also Figure S7D and Table S7H). Bottom insert: region surrounding a mutation found in human frontotemporal dementia (FTD) patients, involving an analogous di-cysteine motif residue. Bottom panel: schematic of the residues mapped on the turquoise killifish protein sequence (grey).
E) Cluster of known aging genes in the lifespan QTL region, in a region of suppressed recombination. Top panel: schematic of the enrichment for known aging-related genes (from GeneAge, human and mouse combined) in the lifespan QTL region (p = 2.1x10⁻⁴, in Fisher’s exact test, compared to rest of the genome, p = 6.4x10⁻⁴ in Fisher’s exact test, compared to the rest of LG-3). Bottom panel: measure of suppressed recombination by allelic distortion between the male and female F2 progeny at each marker on LG-3. See also Figure S7H–S7I. Dash line indicates the genome-wide average for allelic distortion. Light red rectangle: lifespan QTL region. Turquoise rectangle: sex-determining region.

