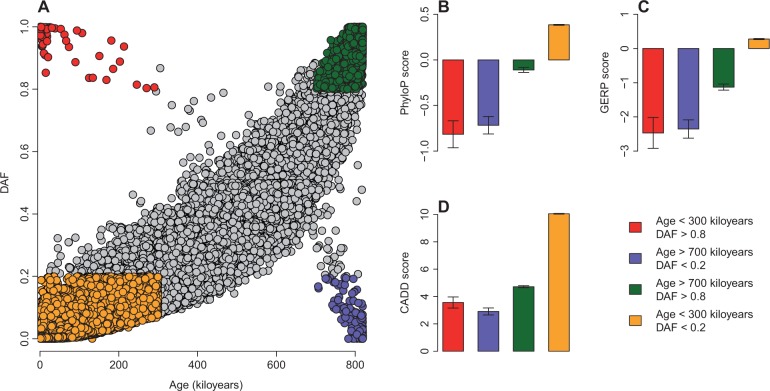
Fig. 6.—
Relationship between SNP age and DAF. (A) DAF increases with SNP age. Outliers are aggregated at the top left (red points with age < 300 kiloyears and DAF > 0.8) and bottom right (blue points with age > 700 kiloyears and DAF < 0.2) corners. SNPs located in the top right (green points with age > 700 kiloyears and DAF > 0.8) and bottom left corners (orange points with age < 300 kiloyears and DAF < 0.2) are highlighted. (B) Comparison of PhyloP score among SNPs located in the four corners in panel A. (C) Comparison of GERP score among SNPs located in the four corners in panel A. (D) Comparison of CADD score among SNPs located in the four corners in panel A.

