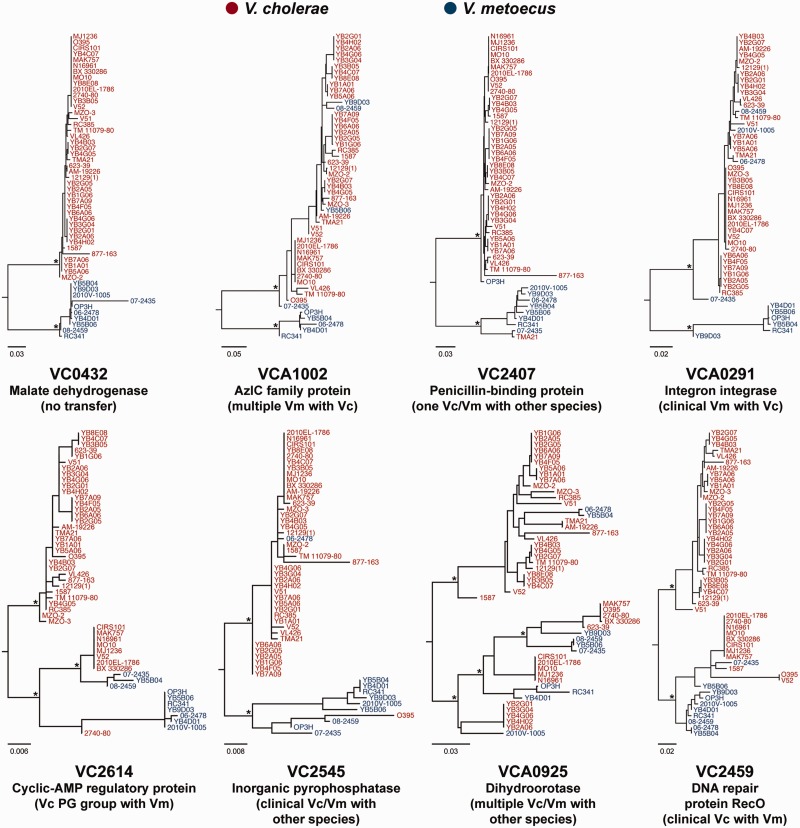
Fig. 4.—
Representative HGT between V. metoecus (Vm) and V. cholerae (Vc). The trees are representative ML phylogenetic trees from 1,560 orthologous families of single-copy core genes showing various examples of transfer events. Bottom trees: Transfers involving at least one clinical V. cholerae clustering with V. metoecus. Relevant bootstrap support (>70%) is indicated with *. The scale bars represent nucleotide substitutions per site.

