
Figure 2.
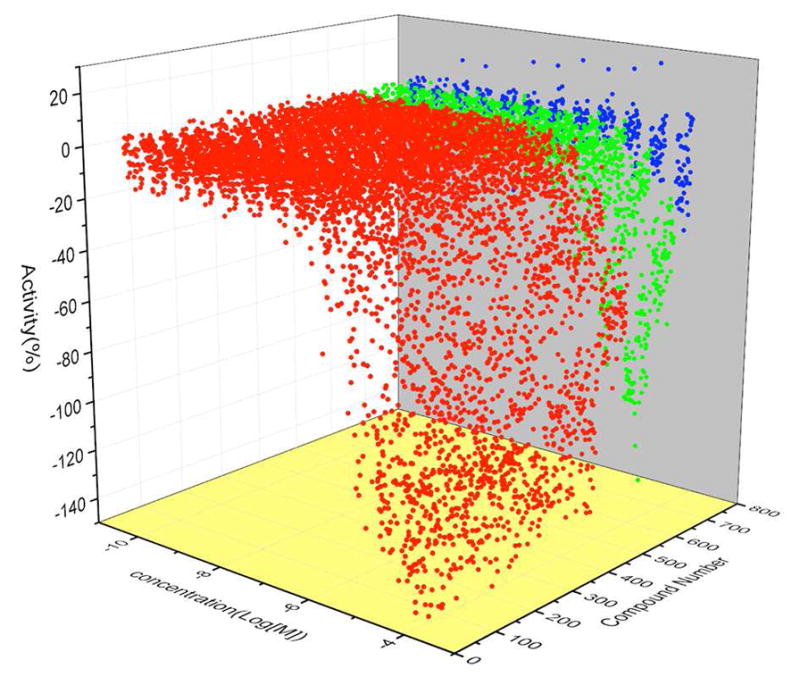
Waterfall plot of concentration response curves in the confirmation assay. Red: active compounds in curve class 1 and 2. Green: weakly active compounds in curve class 3. Blue: inactive compounds in curve class 4.
Official websites use .gov
A
.gov website belongs to an official
government organization in the United States.
Secure .gov websites use HTTPS
A lock (
) or https:// means you've safely
connected to the .gov website. Share sensitive
information only on official, secure websites.
Waterfall plot of concentration response curves in the confirmation assay. Red: active compounds in curve class 1 and 2. Green: weakly active compounds in curve class 3. Blue: inactive compounds in curve class 4.