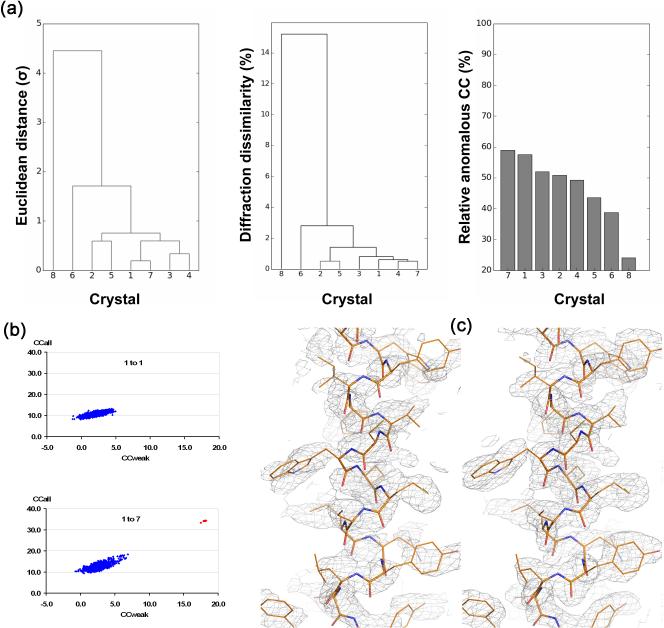
Figure 3. Multiple crystals in SAD phasing.
Data are from studies on CysZ from Idiomarina loihiensis, a transmembrane sulfate permease [48]. (a) Clustering analysis of crystal variations. Crystal 8 is an outlier. (left) Unit-cell variation, (middle) diffraction dissimilarity, and (right) relative anomalous correlation coefficient (RACC). (b) Substructure determination analyses by SHELXD. (top) Analysis from data of only the best crystal (1 to 1), and (bottom) analysis for data as merged from all seven statistically equivalent crystals (1 to 7). (c) SAD electron densities for a representative helix after density modification. (left) The map based on the substructure model deduced from the 1-to-7 data set but applied to the data from Crystal 1 alone, and (right) the map after SAD phasing of the 1-to-7 data set.

