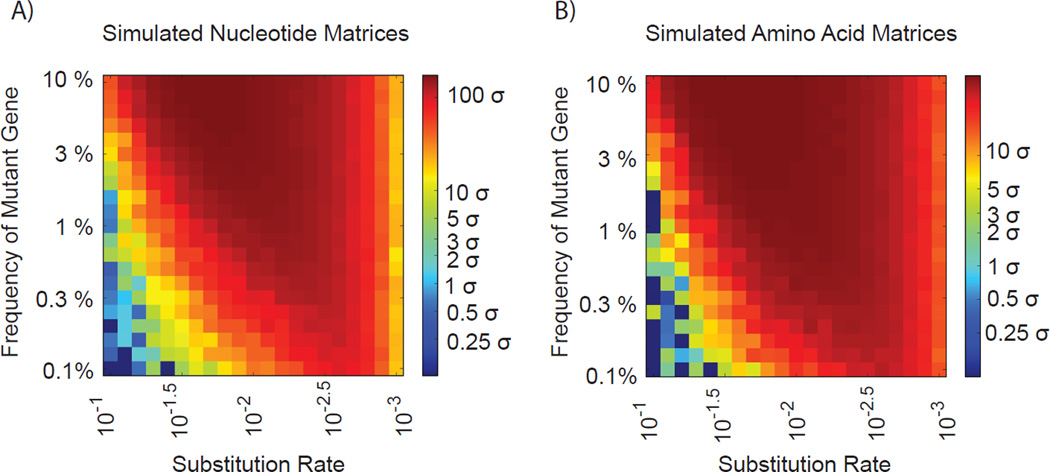
Figure 2.
Simulated datasets with varying degrees of random substitution rates (x-axis) was generated for a hypothetical RNAseq experiment covering a range of ratios (y-axis) of wild-type to mutant Flock House Virus RNA 3 and passed through the CoVaMa pipeline. Each point in the heatmaps represents the output from an individual simulated dataset for A) the known mutated nucleotide pair and B) the known mutated amino acid pair. The colour of the heatmap reflects the number of standard deviations (σ) that the expected mutant pair was distinct from the mean of the entire distribution of LD values.

