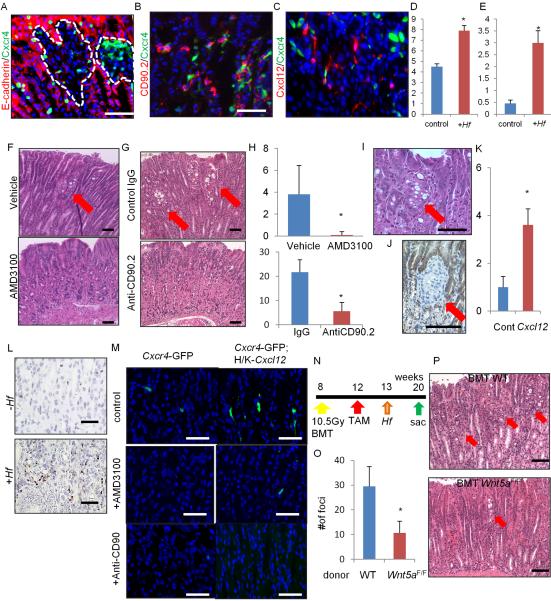
Figure 6. Cxcl12/Cxcr4 perivascular niche regulates DGC progression through Wnt5a production.
(A–E) E-cadherin (A) and CD90.2 staining (B) (red) of Mist1-CreERT2;Cdh1flox/flox;Cxcr4-EGFP (green) mice, and Mist1-CreERT2;Cdh1flox/flox;Cxcl12-dsRED (red);Cxcr4-EGFP (green) (C) mice treated with TAM and Hf (6 months). Numbers of Cxcl12+ cells (D) and Cxcr4+CD90.2+ cells (E) per gland with or without Hf infection. Total 20 glands per group were analyzed. (F–H) H&E staining of Hf-infected Cdh1ΔMist1 mice treated with or without AMD3100 (F), or treated with control IgG Ab or anti-CD90.2 Ab (G). The numbers of atypical foci per section (H). n = 4 mice/group and 4 sections/mouse are analyzed. Arrows indicate atypical foci. (I–K) H&E (I) and E-cadherin (J) staining, and numbers of atypical foci per section (K) in Cdh1ΔMist1 mice crossed to H/K-ATPase-Cxcl12 mice 3 months after TAM. n = 3 mice/group and 4 sections/mouse are analyzed. Arrows indicate atypical foci. (L) In situ hybridization of Wnt5a in Cdh1ΔMist1 mice with or without Hf infection. (M) Cxcr4-EGFP expression in WT and H/K-ATPase-Cxcl12 mouse stomach treated with control, AMD-3100, or anti-CD90.2 Abs. (N–P) Control or Cag-CreERT;Wnt5aflox/flox mouse bone marrow cells were transplanted into Mist1-CreERT2;H/K-ATPase-Cxcl12;Cdh1flox/flox mice after 10.5 Gy whole body irradiation (N). The numbers (O) of atypical foci per section and H&E staining (P) are shown. n = 4 mice/group and 4 sections/mouse are analyzed. Arrows indicate atypical foci. Means ± SEM. *p < 0.05. Bars=50 μm (A–C, F–G, L–M), 100 μm (I–J, P). See also Figure S6.

