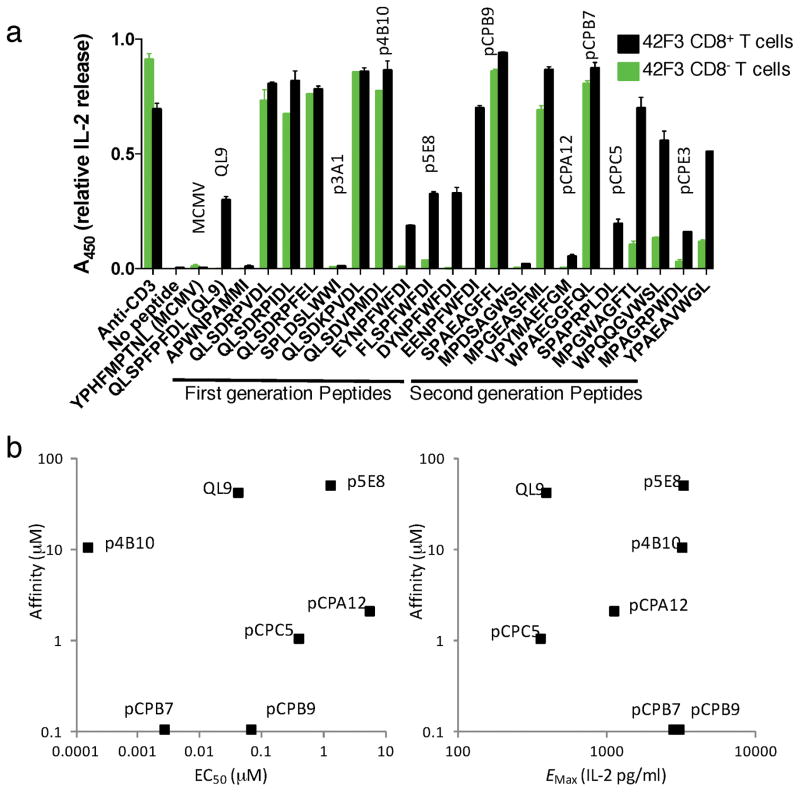
Fig. 2.
Signaling properties of synthetic peptide antigens
(a) IL-2 response screen of the CD8+ (black bars) and CD8- (green bars) 42F3 T cells to APCs in the presence of 10μM synthesized peptide from first-generation (left) and second-generation (right) yeast displayed pMHC libraries. Data is represented as mean ± s.e.m. relative A450, normalized to anti-CD3 stimulation condition n=2 of technical replicates. (b) Scatterplots showing a wide range in affinities and activities, but little correlation between the IL-2 EC50 (left) or maximal IL-2 response (Emax) (right, as shown in Supplementary Fig. 2) of CD8+ 42F3 T with affinity of the 42F3-pMHC interactions. pCPE3 is a weak agonist for which EC50 and Emax were not determined, and was therefore omitted from this analysis.

