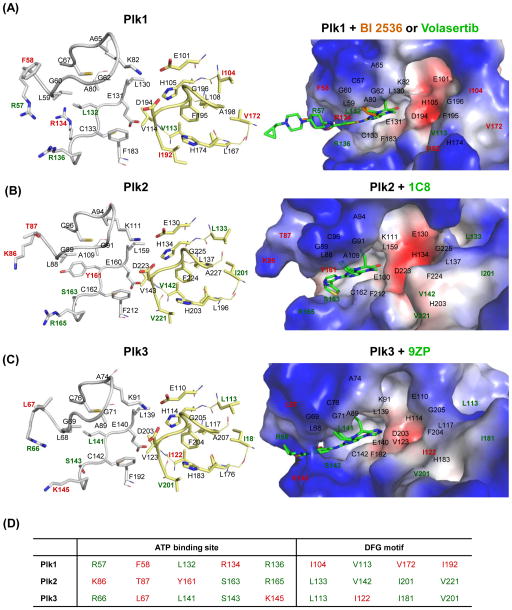
Figure 4.
The mode of small-molecule inhibitors binding to the ATP-binding site of Plk1–3. (A) The Plk1 catalytic domain with BI 2536 (brown; PDB 2RKU) [53] and volasertib (green; PDB 3FC2) [94]; (B) the Plk2 catalytic domain with 1C8 (PDB 4I6H), [152]; and (C) the Plk3 catalytic domain with 9ZP (PDB 4B6L) are shown. (Left) The active sites of Plks are displayed in stick models in the left panel. Residues establishing interactions with the ligands are displayed in gray stick models. Residues at and around the DFG motif are shown in yellow stick models. (Right) The binding modes of specific ligands are shown in electrostatic surface representations. Residues specific to each Plk are indicated in red, while residues present in two of Plk1–3 are shown in green. The catalytic domain of Plk4 is excluded because of a low level of similarity to Plk1–3. (D) Unique residues in each Plk isoform are indicated in red, while residues overlapped in two of Plk1–3 are denoted in green.

