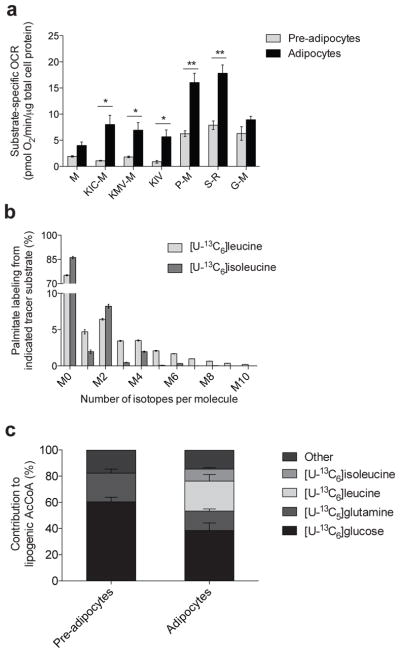
Figure 3. BCAA catabolism fuels mitochondrial metabolism and lipogenesis in adipocytes.
(a) Substrate–specific oxygen consumption rate (OCR) in permeabilized 3T3–L1 pre–adipocytes and adipocytes. Substrate key: M: malate; KIC–M: keto–isocaproate and malate; KMV–M: keto–methylvalerate and malate; KIV: keto–isovalerate; P–M: pyruvate and malate; S–R: succinate and rotenone; G–M: glutamate and malate. 250 nM AdoCbl and biotin were supplemented to the respirometry medium. Data shown are from at least 5 biological replicates each with 4 technical replicates; *represents p<0.05, **represents p<0.01 by Student’s 2–tailed t–test.
(b) Palmitate labeling in 3T3–L1 adipocytes from [U–13C6]leucine and [U–13C6]isoleucine. Minimal label was detected in palmitate from [U–13C5]valine.
(c) Contribution of each tracer substrate to lipogenic AcCoA in 3T3–L1 pre–adipocytes and adipocytes after correction due to tracer dilution. BCAA contributions were adjusted to account for dilution of intracellular amino acids from protein turnover using the average BCAA labeling over the course of the experiment.
Data presented in (a) is mean ± s.e.m., (b) is mean ± s.d., and (c) is model output ± 95% c.i.

