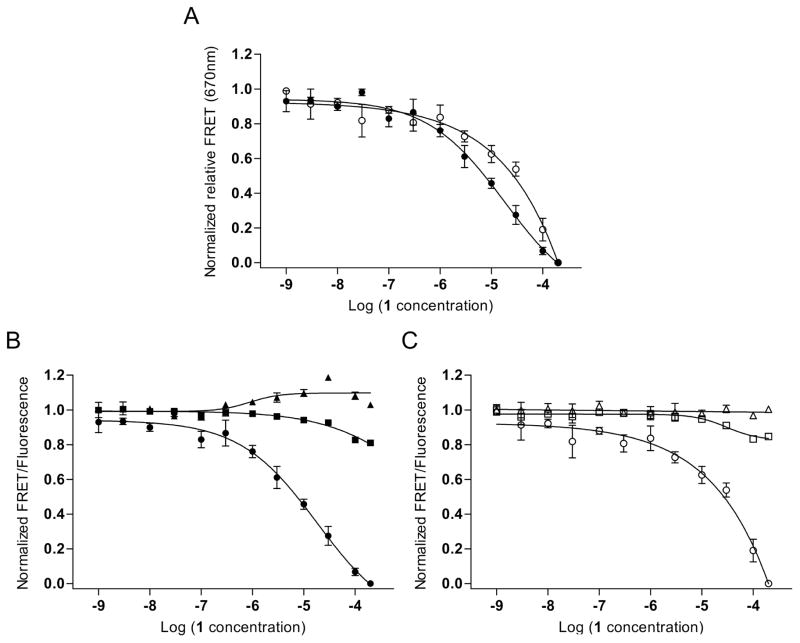
Fig. 3.
Binding of a translation inhibitor ligand 1 [13, 24] to the HCV RNA switch as monitored by FRET experiments with cyanine dye-labeled oligonucleotides. (A) Normalized relative FRET signal for the titration of 1 to a conventional model construct of the HCV IRES subdomain IIa switch 5′ terminally conjugated with Cy3 and Cy5 dyes (●) and a modular FRET construct consisting of unmodified oligonucleotides that contain the HCV RNA switch and carry overhanging single strands which hybridize with cyanine dye-conjugated DNA oligonucleotides (○). Dose-response fitting curves gave an EC50 value for capture of the extended switch state of 22 ± 12 μM for the conventional construct and 37 ± 21 μM for the modular construct. As the FRET signal for the modular system did not reach saturation, affinity of compound 1 was calculated by dose-response fitting to the Cy5 emission signal. (B) Individual dye and FRET signals for the conventional model construct. (●)=FRET; (■)=Cy5; (▲)=Cy3. (C) Individual dye and FRET signals for the modular construct. (○)=FRET; (□)=Cy5; (△)=Cy3. Error bars represent ±1 s.d. calculated from triplicate experiments.

