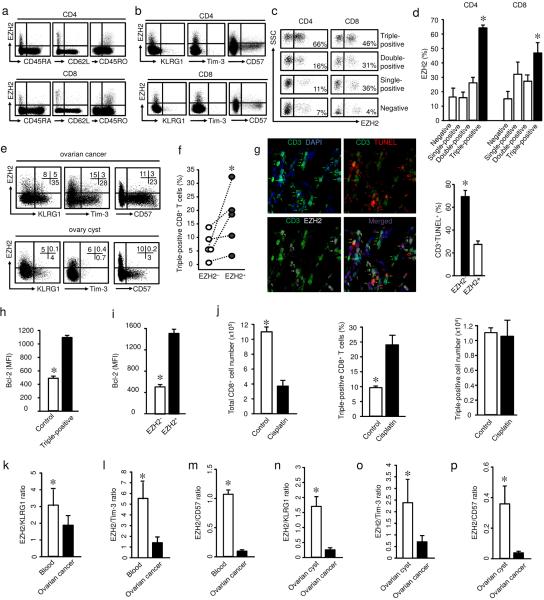
Fig. 1. EZH2+ T cells endow polyfunctional and apoptosis resistant features.
(a,b) Phenotype of EZH2+ T cells. Peripheral blood mononuclear cells from healthy donors were stained with antibodies against EZH2, CD45RA, CD62L, CD45RO, KLRG1, Tim-3, CD57 and T cell markers, and analyzed with LSR II. One representative of 8 donors is shown.
(c,d) EZH2 and polyfunctional T cells in blood. Intracellular staining was performed in peripheral blood mononuclear cells for IFN-γ, TNF, and granzyme B. EZH2 expression was analyzed in CD4+ T cells expressing single, double, triple, or no markers for IL-2, IFN-γ, and TNF, or CD8+ T cells expressing single, double, triple or no markers for IFN-γ, TNF, and granzyme B. Results are shown as one of 6 flow cytometry dot plots (c) and the mean percentage ± SEM (d). Wilcoxon rank-sum test, *P <0.05.
(e) EZH2+ T cells in ovarian cancer. Single cells were made from ovarian cancer tissues and were stained for T cell markers, KLRG1, Tim-3, CD57 and EZH2. CD8+ T cells were analyzed by flow cytometry. Numbers in the quadrants are percentage of the cells in CD45+CD3+CD8+ gate. One representative donor of 20 is shown.
(f) EZH2 and polyfunctional T cells in ovarian cancer. Intracellular staining was performed in single cells made from ovarian cancer tissues for T cell markers, IFN-γ, TNF, granzyme B, and EZH2. IFN-γ, TNF, and granzyme B triple positive (polyfunctional) CD8+ T cells were analyzed on the basis of EZH2 expression. N = 5, Wilcoxon rank-sum test, *P <0.01.
(g) Relationship between EZH2 expression and T cell apoptosis in ovarian cancer. Frozen ovarian cancer tissues were stained with anti-CD3 (green), anti-EZH2 (white), TUNEL (red), and DAPI (blue). TUNEL+CD3+EZH2+ T cells (White) are marked with white arrows. The percentage of TUNEL+CD3+ T cells (mean ± SEM) was determined in EZH2+ and EZH2− T cells. N = 10, Wilcoxon rank-sum test, *P < 0.05.
(h) Expression of Bcl-2 in polyfunctional T cells. CD8+ T cells were stimulated with anti-CD3 and anti-CD28 for 2 days. Expression of IFN-γ, TNF, granzyme B, and Bcl-2 was analyzed by flow cytometry. Results are shown as the mean fluorescent intensity (MFI) of Bcl-2 expression (mean ± SD) in polyfunctional (triple positive) CD8+ T cells. N = 6, Wilcoxon rank-sum test, *P <0.05.
(i) Expression of Bcl-2 in EZH2+CD8+ T cells. CD8+ T cells were stimulated with anti-CD3 and anti-CD28 for 2 days. Expression of EZH2 and Bcl-2 was analyzed by flow cytometry. Results are shown as the MFI of Bcl-2 expression (mean ± SD) in EZH2+CD8+ T cells. N = 6, Wilcoxon rank-sum test, *P <0.05.
(j) Effects of cisplatin on polyfunctional T cells. CD8+ T cells were stimulated with anti-CD3 and anti-CD28 for 5 days. Cisplatin was added in culture on day 4. Cells were stained for polyfunctional phenotype (IFN-γ, TNF, and granzyme B). Total T cell number, the percentage and absolute numbers of triple-positive CD8+ T cells were shown. N = 4, Wilcoxon rank-sum test, *P < 0.05.
(k–m) Ratios of EZH2/KLRG1 (k), EZH2/Tim-3 (l), and EZH2/CD57 (m) in ovarian cancer infiltrating T cells and peripheral blood T cells. The levels of KLRG1, Tim-3, and EZH2 expressing CD8+ T cells were analyzed by flow cytometry. Results are shown as mean ± SEM. N = 30, Mann-Whitney U-test, *P < 0.05.
(n–p) Ratios of EZH2/KLRG1 (n), EZH2/Tim-3 (o), and EZH2/CD57 (p) in ovarian cancer infiltrating T cells and T cells in normal ovary cysts. CD8+ T cells were analyzed by flow cytometry, data are shown as mean ± SEM. Ovary cyst tissues: N=11, cancer samples: N=7, Mann-Whitney U-test, *P < 0.05.

