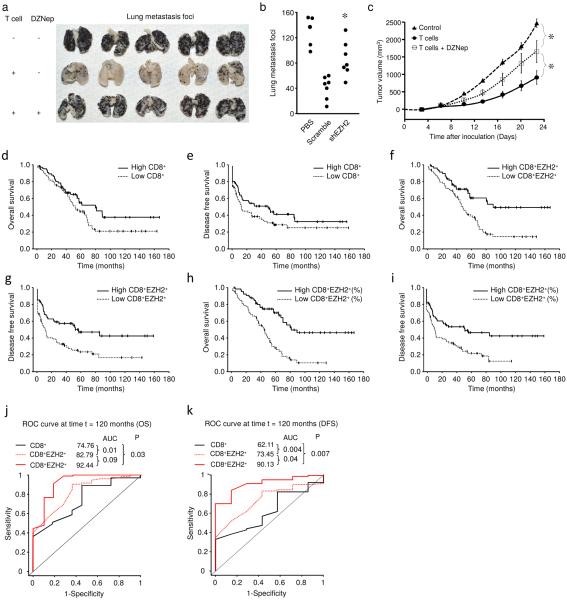
Fig. 6. EZH2 affects T cell-mediated anti-tumor immunity and patient survival.
(a) Effects of biochemical blockade of T cell EZH2 on mouse melanoma metastasis. Melanoma cells were intravenously injected into C57BL/6 mice to induce lung metastasis. Tumor specific T cells were activated in the presence or absence of 1 μM DZNep for 2 days and expanded in IL-2 for 3 days. These T cells were intravenously transfused into tumor-bearing mice. Lung metastatic loci were counted on day 16. N = 15 mice total, 5 per group, all individuals shown.
(b) Effects of genetic blockade of T cell EZH2 on mouse melanoma metastasis. Tumor specific T cells transfected with lentiviral vector expressing shEZH2 or scramble were activated for 2 days and expanded in IL-2 for 3 days. These T cells were intravenously transfused into tumor-bearing mice. Lung metastatic loci were counted on day 16. N = 5–7 per group, each dot represents individual mouse. Mann-Whitney U test, *P < 0.05 (shEZH2 compared to scramble).
(c) Effects of T cell EZH2 blockade on human ovarian cancer growth. Human primary ovarian cancer cells were subcutaneously injected into female NOD/Shi-scid/IL-2Rγnull (NSG) mice. Tumor-specific T cells were initially treated with or without 1 μM DZNep in vitro and were intravenously transferred into ovarian cancer bearing NSG mice. Tumor volume was measured. Results are expressed as the tumor volume (mean ± SEM). N = 5 mice per group, Mann-Whitney U test, *P < 0.05.
(d–i) Tumor infiltrating T cells and patient outcome. Ovarian cancer tissue microarray was subject to immunohistochemistry staining with anti-CD8 and anti-EZH2 antibodies. CD8+ and EZH2+CD8+ T cells were quantified. Kaplan–Meier estimates of overall survival and progression-free interval were performed according to the median values of CD8+ T cell numbers (d,e), EZH2+CD8+ T cell numbers (f,g), and the percentage of EZH2+CD8+ T cells
(h,i). Kaplan-Meier estimates are shown in Supplementary Tables 1–3.
(j,k) Relative impact of CD8+ T cell numbers, EZH2+CD8+ T cell numbers, and the percentage of EZH2+CD8+ T cells on patient long-term survival. The time-dependent receiver operating characteristic (ROC) curve analysis was applied to evaluate the predictive accuracy of each marker for a 10-year overall survival (OS) (j) and disease free survival (DFS) (k). AUC, the area under the ROC curve.

