
Figure 1. Lesion overlay map. Z: superior-inferior coordinate in the Talairach space.
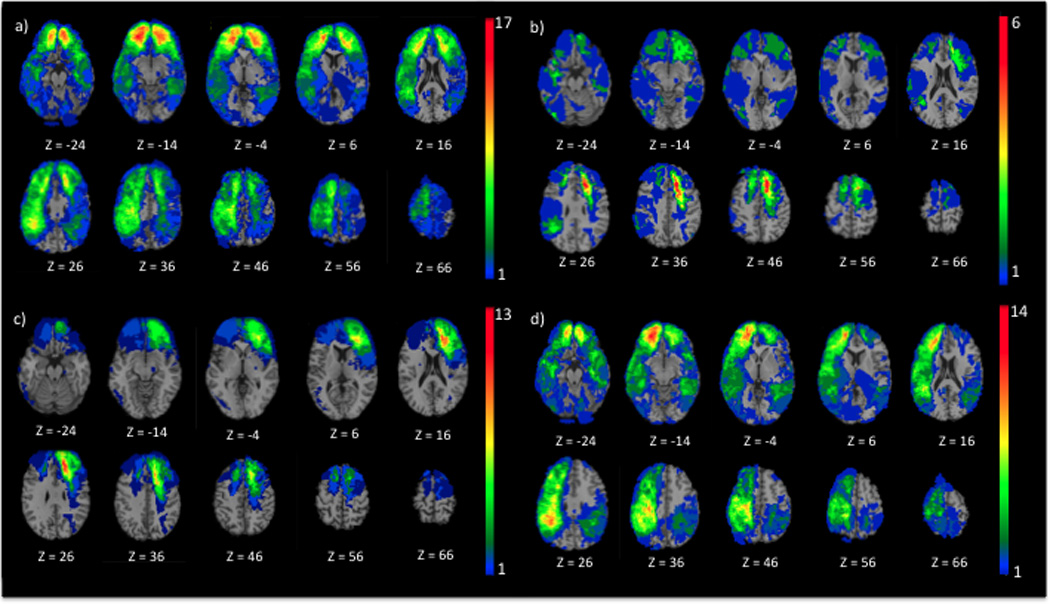
a) Entire TBI sample (n=105), b) participants with TBI (n=24) whose caregiver had significant caregiver burden (ZBI total score ≥ 24), c) TBI-T, participants whose lesion comprised left dACC and dlPFC (n=13), and d) TBI-C, participants whose lesion does not comprise left dACC and dlPFC (n=92). The color bar represents the number of overlapping lesions at each voxel. Red indicates a greater number of participants with TBI who have a lesion on a particular voxel. In each image, the right hemisphere is on the reader’s left.