
Figure 2. Subtraction and conjunction maps.
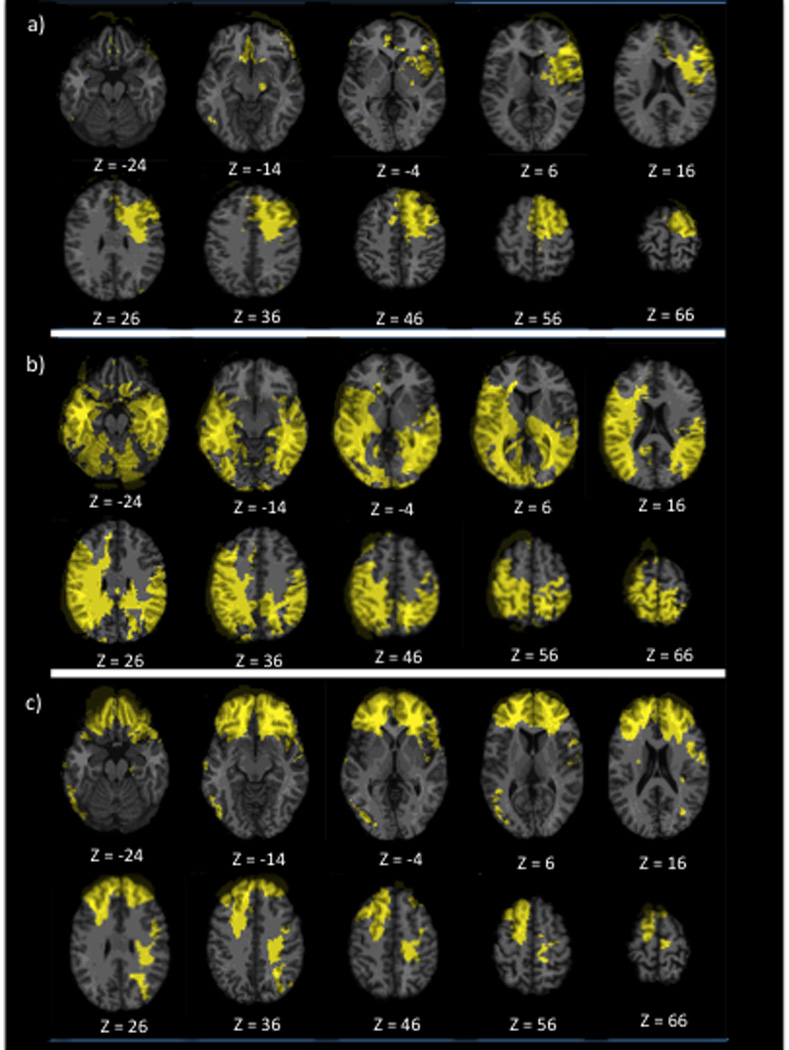
a) Subtraction overlay map showing lesions present only in the TBI-T group, b) Subtraction overlay map showing lesions present only in the TBI-C group, c) Conjunction overlay map showing lesions present in both TBI groups. In each slice, the right hemisphere is on the reader’s left and the lesions are represented in yellow.