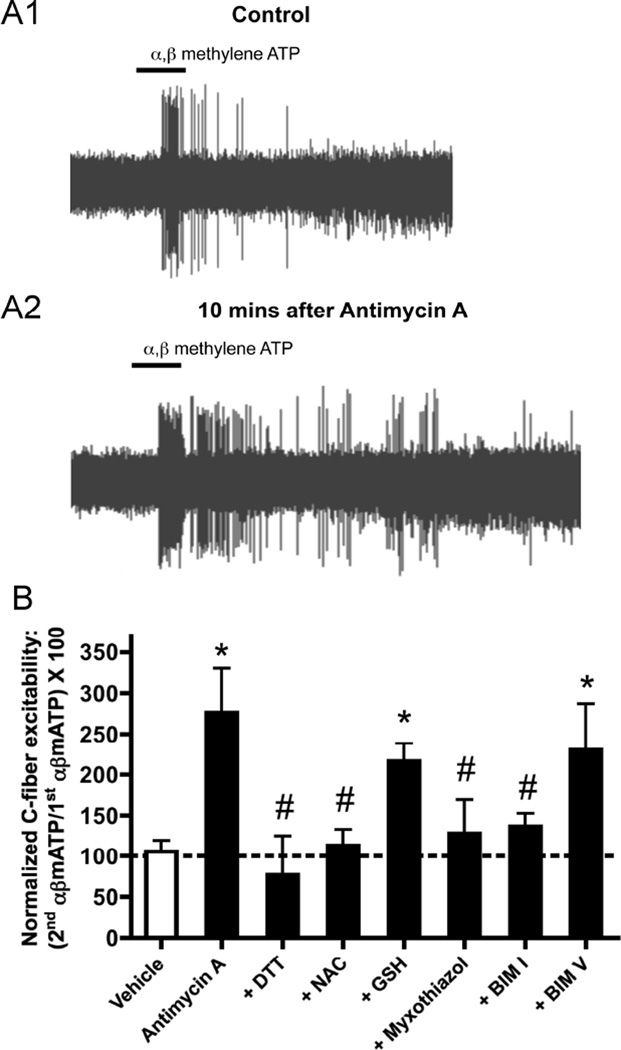
Fig. 1. Antimycin A activates nociceptive bronchopulmonary C-fibers via TRPA1 and TRPV1.
A, representative trace showing action potential discharge to antimycin A (20 µM, blocked line denotes 10s application) in an individual TRPA1-expressing bronchopulmonary C-fiber. B, Mean ± SEM peak action potential discharge from individual bronchopulmonary C-fibers in response to antimycin A, grouped according to their response to selective TRPA1 agonists (data not shown). Data in all columns only includes nociceptive wild-type, defined by conduction velocity and sensitivity to capsaicin (1 µM) (data not shown). Left, responses in control wild-type TRPA1-expressing fibers (black column) are compared with responses in the presence of 30 µM HC-030031 (gray column) and 1 mM GSH (hatched column). Right, responses in control wild-type fibers not expressing TRPA1 (black column) are compared with responses in the presence of 1 µM I-RTX. * Significant reduction compared to control (p<0.05). Adapted from [36].

