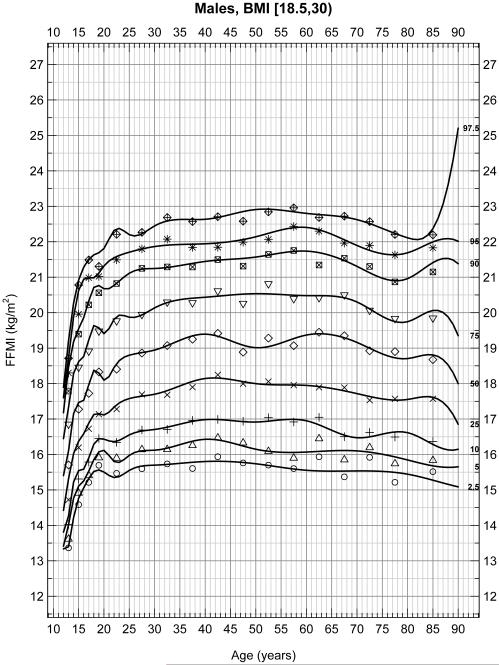
Figure 1B.
Selected percentiles (2.5, 5, 10, 25, 50, 75, 90, 95, 97.5) for female FFMI. Continuous line depicts quantile regression spline fits; dots represent the corresponding observed quantiles centered at the following half-closed age group intervals [a,b) = {x | a ≤ x < b} with cut-points at 12[2]20[5]80 years.

