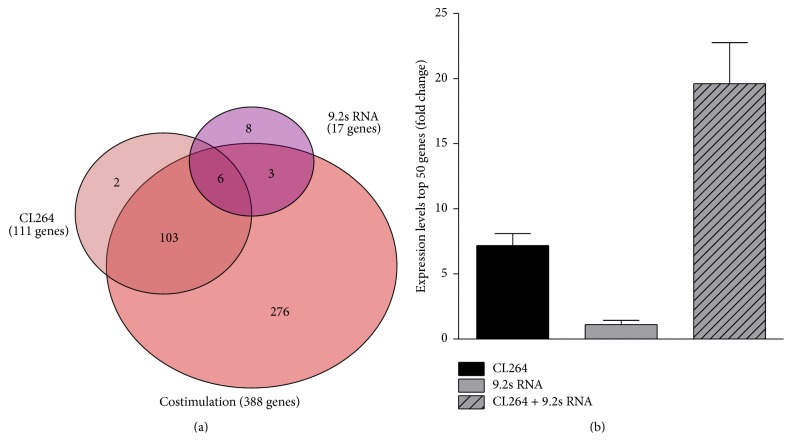
Figure 2.
Changes in gene expression patterns of CAL-1 cells upon stimulation with CL264 and/or 9.2s RNA. CAL-1 cells were seeded into 24-well plates. After overnight resting, they were stimulated with CL264 (5 µg/mL) or 9.2s RNA (2 µg/mL) or the combination of both. After incubation for 4 hrs, cells were lysed and total RNA was extracted. Following cDNA synthesis, labeled cDNA was hybridized to microarrays. Treatment groups were normalized to untreated controls. (a) Venn diagram showing changes in gene expression patterns using a statistical cutoff of p < 0.001. (b) Expression levels of the 50 most significantly upregulated genes in each treatment group, compared to untreated cells.

