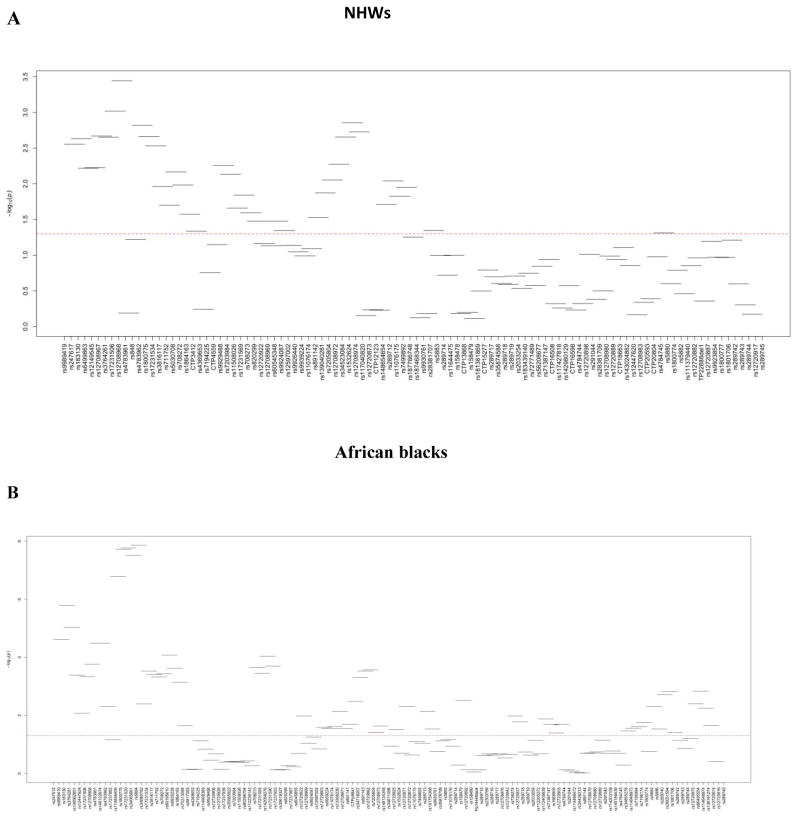
Fig. 5. CETP haplotype analysis with HDL-C levels in NHWs and African blacks.
Haplotype windows for NHWs (A) and for African blacks (B). The global (-log)10 P values are presented in the y-axis. Horizontal lines represent the window tested (101 haplotype windows in NHWs and 128 haplotype windows in African blacks). Variants are shown on the x-axis. Red line shows the threshold for statistical significance (P=0.05).

